Fig. 19
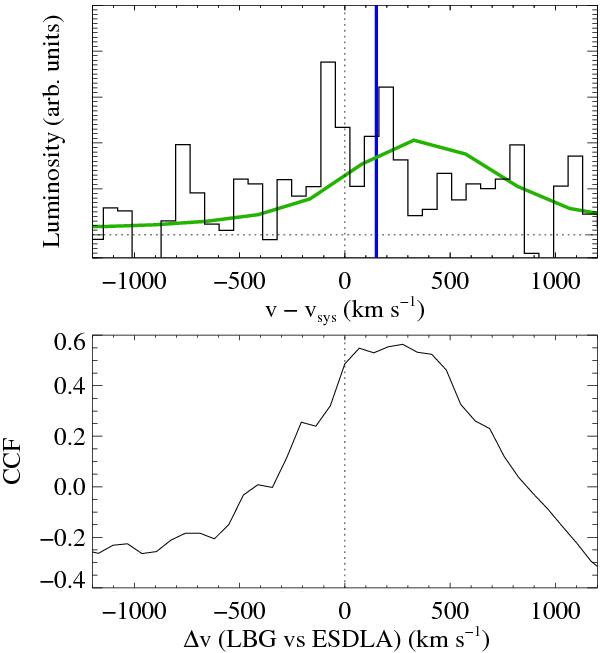
Top: velocity offset of the Ly α profile compared to the systemic redshift. The black histogram shows the stacked ESDLA spectrum, the green line represents the LBG composite (Shapley et al. 2003, scaled down for illustration purposes) and the vertical blue line marks the typical velocity shift observed in LAEs (McLinden et al. 2011; Finkelstein et al. 2011; Hashimoto et al. 2013). Bottom: cross-correlation function obtained by correlating the Lyman-break galaxy and the ESDLA (3σ-clipped mean luminosity) composites at different velocities. The Ly α emission in the LBG composite is redshifted compared to that of ESDLAs by about 250 km s-1. The ESDLA Ly α emission redshift is much closer to the systemic redshift from the low-ionisation metal lines. .
Current usage metrics show cumulative count of Article Views (full-text article views including HTML views, PDF and ePub downloads, according to the available data) and Abstracts Views on Vision4Press platform.
Data correspond to usage on the plateform after 2015. The current usage metrics is available 48-96 hours after online publication and is updated daily on week days.
Initial download of the metrics may take a while.