Fig. 16
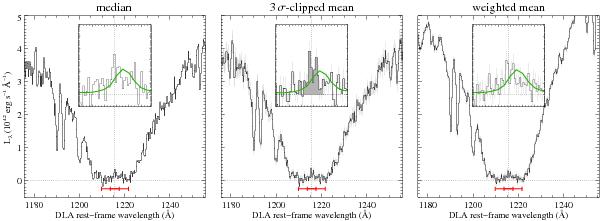
Results from spectral stacking. From left to right, the stacked spectrum corresponds to the median values, 3σ-clipped mean and weighted mean. The long red segment shows the DLA core region over which τ > 6 for log N(H i) ≥ 21.7, ensuring no residual flux from the quasar. This region is highlighted in the inset panels. The short red segment (inner tick marks) indicates the 1000 km s-1 central region over which the Ly α luminosity is integrated. The green spectrum is the composite Lyman-break galaxy spectrum from Shapley et al. (2003), scaled to match the same luminosity in the Ly α region.
Current usage metrics show cumulative count of Article Views (full-text article views including HTML views, PDF and ePub downloads, according to the available data) and Abstracts Views on Vision4Press platform.
Data correspond to usage on the plateform after 2015. The current usage metrics is available 48-96 hours after online publication and is updated daily on week days.
Initial download of the metrics may take a while.