Fig. 14
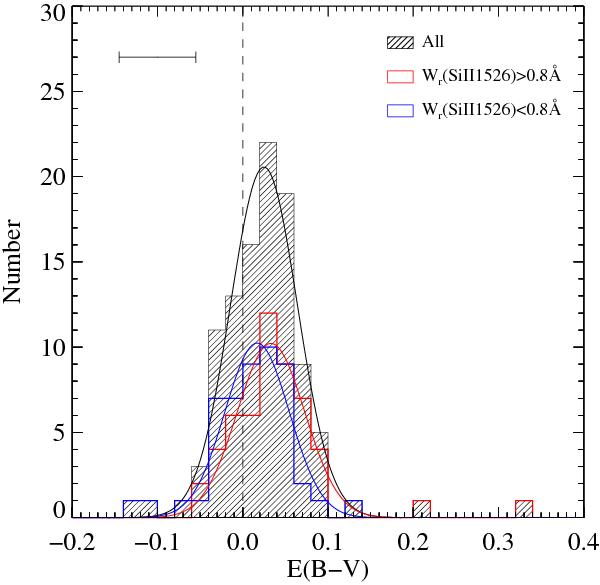
Distribution of E(B − V) values (full sample as hashed histogram, subsample with Wr(Si iiλ1526) above (respectively below) 0.8 Å in red (respectively blue) unfilled histogram), fitted with Gaussian functions. The horizontal error bar in the upper left corner indicates the typical error on E(B − V), obtained from the standard deviation of the values in each control sample.
Current usage metrics show cumulative count of Article Views (full-text article views including HTML views, PDF and ePub downloads, according to the available data) and Abstracts Views on Vision4Press platform.
Data correspond to usage on the plateform after 2015. The current usage metrics is available 48-96 hours after online publication and is updated daily on week days.
Initial download of the metrics may take a while.