Fig. 13
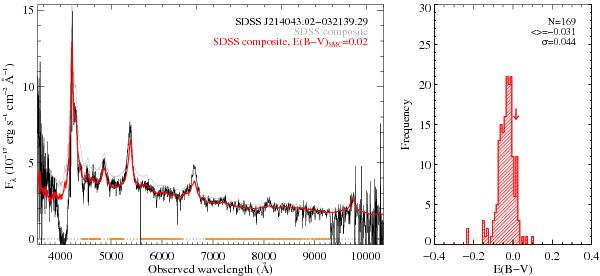
Left: ESDLA BOSS spectrum (black) with the SDSS composite spectrum (grey) reddened by the SMC extinction-law at zabs(red) with E(B − V) = 0.02. The orange segments indicate the regions used for the fit. Right: distribution of E(B − V)-values for the corresponding control sample. In this example, the “zero-point” (respectively dispersion) of the distribution is −0.03 (respectively 0.044). The value retained for the DLA here is thus E(B − V) = 0.05 ± 0.05.
Current usage metrics show cumulative count of Article Views (full-text article views including HTML views, PDF and ePub downloads, according to the available data) and Abstracts Views on Vision4Press platform.
Data correspond to usage on the plateform after 2015. The current usage metrics is available 48-96 hours after online publication and is updated daily on week days.
Initial download of the metrics may take a while.