Fig. 11
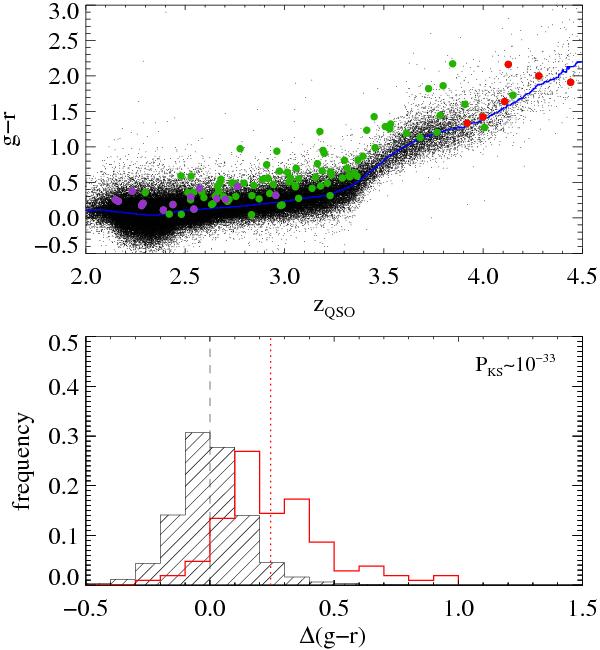
Top: (g − r) colour of the background QSOs as a function of redshift. The black points represent the DR11 QSO sample. QSOs with foreground ESDLA that have a Ly α centroid that falls in the u, g, and r-band are represented by purple, green and red points respectively. The blue line shows the change in the median colour of the overall QSO sample as a function of redshift. Bottom: normalised distributions of colour excess Δ(g − r) = (g − r) − ⟨g − r⟩z for the DR11 QSO sample (black hashed histogram) and the QSO with foreground ESDLAs (red unfilled histogram). The vertical lines mark the medians of the two distributions.
Current usage metrics show cumulative count of Article Views (full-text article views including HTML views, PDF and ePub downloads, according to the available data) and Abstracts Views on Vision4Press platform.
Data correspond to usage on the plateform after 2015. The current usage metrics is available 48-96 hours after online publication and is updated daily on week days.
Initial download of the metrics may take a while.