Fig. 3
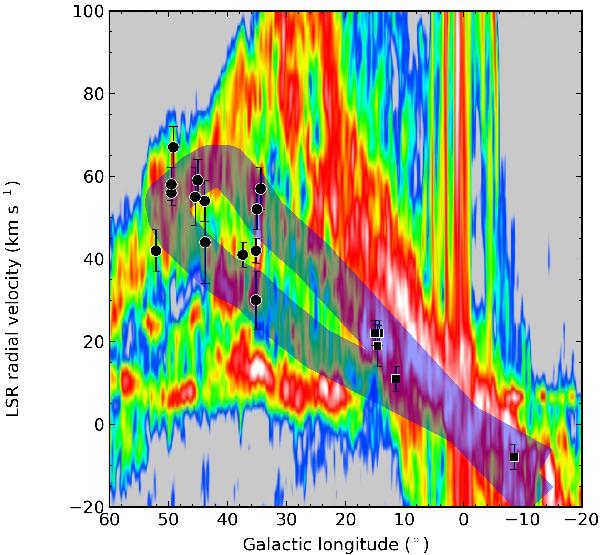
Longitude–velocity diagram of CO emission from the CfA 1.2-m survey (Dame et al. 2001). The shaded region denotes the trajectory of the Sagittarius arm from Burton & Shane (1970). The width of the shaded region corresponds to a ±5 km s-1 velocity dispersion. Dots indicate the HMSFRs assigned to the arm based on the longitude–velocity diagram; squares are HMSFRs assigned to the arm based on distances. Error bars reflect the VLSR uncertainties of the HMSFRs listed in Table 2.
Current usage metrics show cumulative count of Article Views (full-text article views including HTML views, PDF and ePub downloads, according to the available data) and Abstracts Views on Vision4Press platform.
Data correspond to usage on the plateform after 2015. The current usage metrics is available 48-96 hours after online publication and is updated daily on week days.
Initial download of the metrics may take a while.