Fig. 5
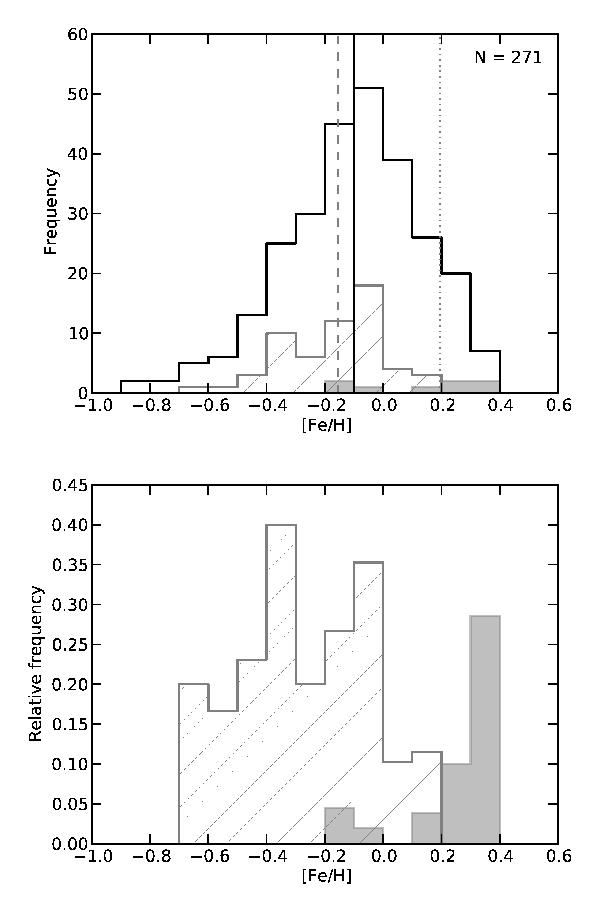
Upper panel: distribution of metallicity for the full sample (black), stars with positive correlation coefficient higher than 0.5 (hatched grey), and stars with negative correlation coefficient lower than −0.5 (filled grey). The black vertical line is the median of the full sample, the dashed vertical line is the median of the positively correlated stars, and the dotted line is the median of the negatively correlated stars. Lower panel: same as the top panel but for relative distributions. The K-S test gives a p-value of 0.01% for the probability that the two populations are drawn from the same distribution.
Current usage metrics show cumulative count of Article Views (full-text article views including HTML views, PDF and ePub downloads, according to the available data) and Abstracts Views on Vision4Press platform.
Data correspond to usage on the plateform after 2015. The current usage metrics is available 48-96 hours after online publication and is updated daily on week days.
Initial download of the metrics may take a while.