Fig. 1
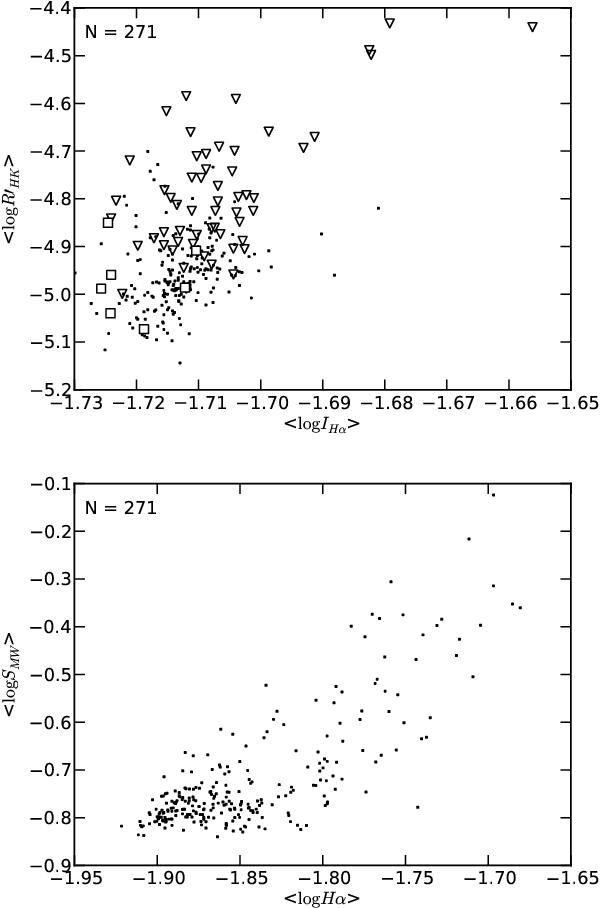
Upper panel: relationship between  and log IHα mean activity levels. Open triangles are stars with positive correlation between the two indices with ρ ≥ 0.5, open squares stars with negative correlation with ρ ≤ − 0.5, and dots stars with no correlations. Lower panel: relationship between the logarithms of SMW and Hα indices.
Current usage metrics show cumulative count of Article Views (full-text article views including HTML views, PDF and ePub downloads, according to the available data) and Abstracts Views on Vision4Press platform.
Data correspond to usage on the plateform after 2015. The current usage metrics is available 48-96 hours after online publication and is updated daily on week days.
Initial download of the metrics may take a while.