Fig. 7
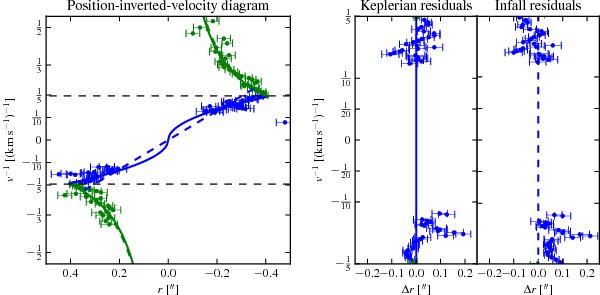
Left: position-inverted-velocity (PIV) diagram of the uvmodelfit peaks in the C17O emission centred at IRS7B. The inverted velocity axis is used to make the origin of the diagram correspond to the central object. Blue dots are used for the ν∝ r−1/2 and ν∝ r-1 fits, green dots for the ν∝ r fit. The velocities are given relative to the centroid velocity, which has a νLSR = 6.2 km s-1. The solid and dashes lines as in Fig. 5. Right: position residuals of the blue (high velocity) data points plotted versus inverse velocity for the two models (Keplerian rotation and infall under conservation of angular momentum), zoomed in to the dashed part of the left panel.
Current usage metrics show cumulative count of Article Views (full-text article views including HTML views, PDF and ePub downloads, according to the available data) and Abstracts Views on Vision4Press platform.
Data correspond to usage on the plateform after 2015. The current usage metrics is available 48-96 hours after online publication and is updated daily on week days.
Initial download of the metrics may take a while.