Fig. 6
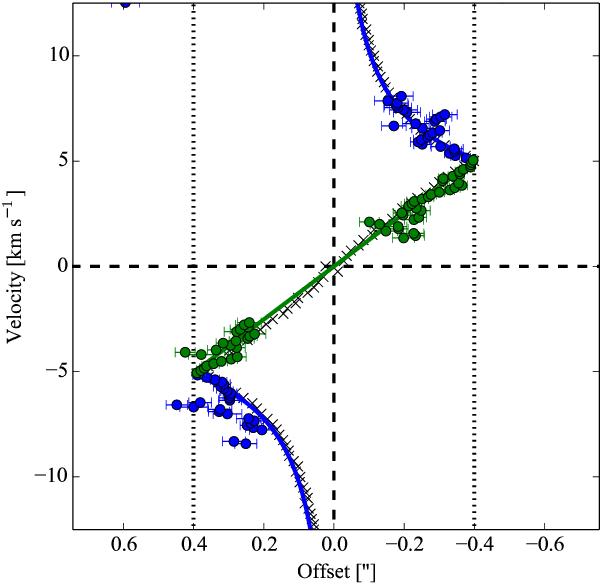
Position-velocity (PV) diagram of the uvmodelfit peaks in the C17O emission centred at IRS7B (blue and green data points). The black crosses are the result of an LTE calculation of a simple flat, Keplerian disc with a radius marked by the vertical, dotted lines. The solid lines as in Fig. 5.
Current usage metrics show cumulative count of Article Views (full-text article views including HTML views, PDF and ePub downloads, according to the available data) and Abstracts Views on Vision4Press platform.
Data correspond to usage on the plateform after 2015. The current usage metrics is available 48-96 hours after online publication and is updated daily on week days.
Initial download of the metrics may take a while.