Fig. 4
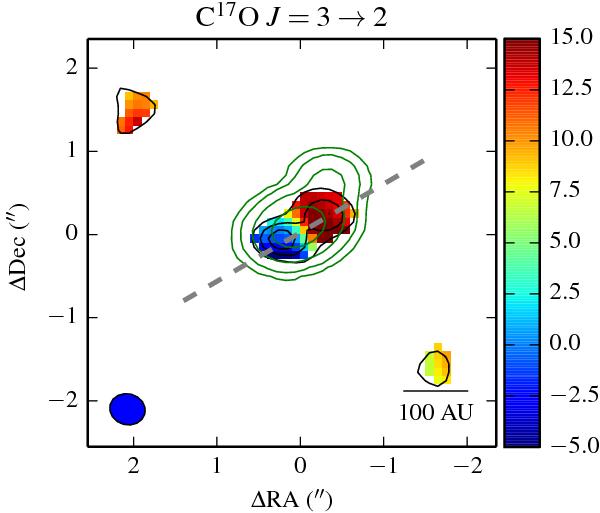
Moment 0 map (black contours at 3σ ≈ 43 mJy beam-1 km s-1 intervals) and moment 1 map (colour scale, velocities in km s-1) of the C17O emission centred at IRS7B, integrated between − 11 km s-1 and + 21 km s-1. The colour bar indicates LSR velocities in km s-1. The dashed grey line indicates the axis along which the PV diagram fits of Figs. 5–7 are made. The dust continuum emission is shown in green contours (logarithmically spaced between 2 mJy and 200 mJy).
Current usage metrics show cumulative count of Article Views (full-text article views including HTML views, PDF and ePub downloads, according to the available data) and Abstracts Views on Vision4Press platform.
Data correspond to usage on the plateform after 2015. The current usage metrics is available 48-96 hours after online publication and is updated daily on week days.
Initial download of the metrics may take a while.