Fig. 3
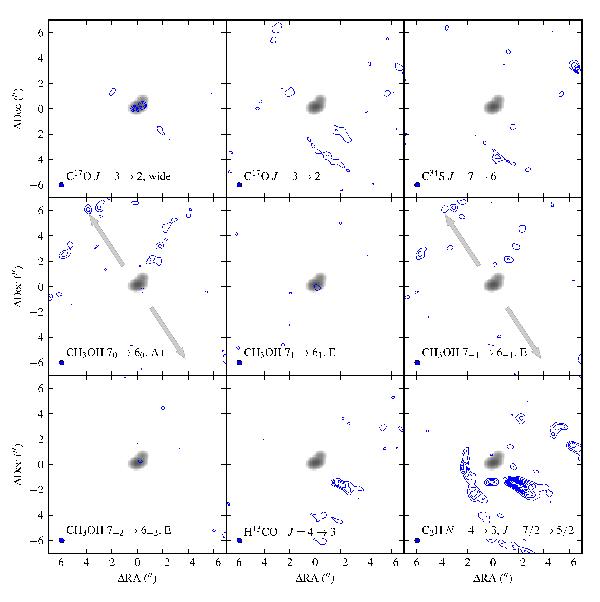
Moment 0 maps (intensity; blue contours) around IRS7B of all detected spectral lines. All lines are integrated between 4.0 and 8.8 km s-1, except for in the first C17O map, where the line is integrated between − 1.7 and + 13.3 km s-1, to cover the high-velocity component of the emission. The contours are in steps of 3σ, between 4.4 and 6.7 mJy beam-1 km s-1 (10.7 mJy beam-1 km s-1 for the wide C17O map). The dust continuum emission is shown in greyscale. The large-scale CH3OH outflow direction is shown with grey arrows.
Current usage metrics show cumulative count of Article Views (full-text article views including HTML views, PDF and ePub downloads, according to the available data) and Abstracts Views on Vision4Press platform.
Data correspond to usage on the plateform after 2015. The current usage metrics is available 48-96 hours after online publication and is updated daily on week days.
Initial download of the metrics may take a while.