Fig. 1
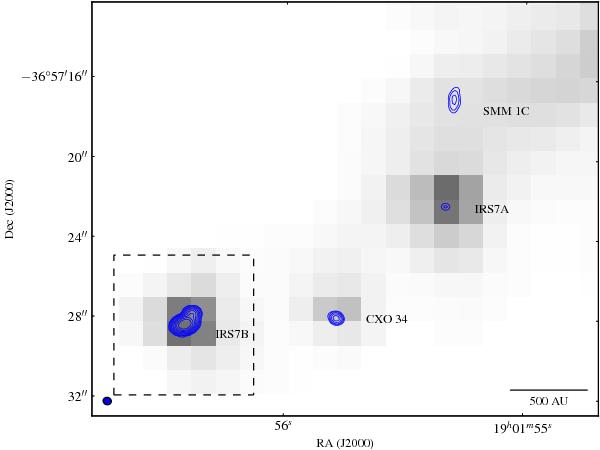
ALMA 342 GHz continuum (blue contours) overplotted on Spitzer 4.5 μm image. The contours are logarithmically spaced, with the first contour at 2 mJy and the tenth and last contour at 200 mJy. The ALMA data are not primary-beam corrected, making the sources far from the phase centre at IRS7B appear fainter than they are. The dashed box shows the coverage of the moment maps in Fig. 3.
Current usage metrics show cumulative count of Article Views (full-text article views including HTML views, PDF and ePub downloads, according to the available data) and Abstracts Views on Vision4Press platform.
Data correspond to usage on the plateform after 2015. The current usage metrics is available 48-96 hours after online publication and is updated daily on week days.
Initial download of the metrics may take a while.