Free Access
Fig. 3
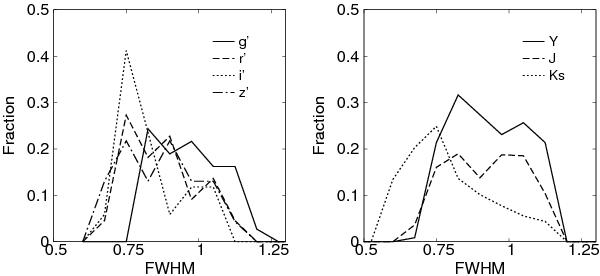
FWHM distribution of each flame we used in the optical (left) and NIR (right). The solid, dashed, dotted, and dashed-dotted lines in the left panel show the g′,r′,i′,z′ bands, respectively, while the solid, dashed, and dotted lines in the right panel represent the Y,J,Ks bands.
This figure is made of several images, please see below:
Current usage metrics show cumulative count of Article Views (full-text article views including HTML views, PDF and ePub downloads, according to the available data) and Abstracts Views on Vision4Press platform.
Data correspond to usage on the plateform after 2015. The current usage metrics is available 48-96 hours after online publication and is updated daily on week days.
Initial download of the metrics may take a while.