Fig. 13
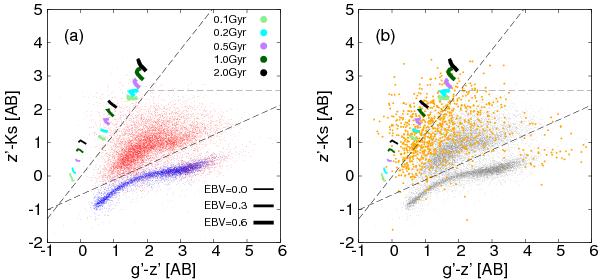
g′z′Ks diagram for AKARI sources with optical counterparts. (Left) blue dots represent stars identified in Sect. 5, and red dots indicate galaxies with zp< 1.4. The dashed lines are the borders given by Eqs. (2)–(4). Bruzual & Charlot (2003) stellar population synthesis models for g′z′Ks color–color diagram with 1.4 <zp< 2.5, which Arcila-Osejo & Sawicki (2013) show are overplotted for comparison. Ages in Gyr are shown with different colors, while different E(B − V) are represented with different line thicknesses. (Right) 1.4 <zp< 2.5 AKARI sources are plotted in yellow. The zp< 1.4 sources shown in the left panel are also plotted but in gray.
Current usage metrics show cumulative count of Article Views (full-text article views including HTML views, PDF and ePub downloads, according to the available data) and Abstracts Views on Vision4Press platform.
Data correspond to usage on the plateform after 2015. The current usage metrics is available 48-96 hours after online publication and is updated daily on week days.
Initial download of the metrics may take a while.