Free Access
Fig. 6
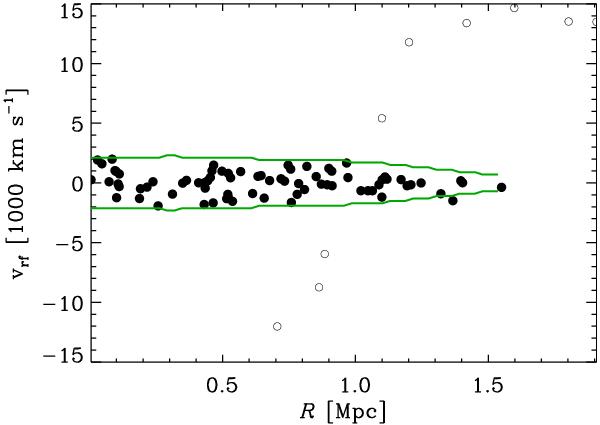
Projected phase space distribution of galaxies with redshifts in the cluster region. Selected cluster members are shown as filled dots. The chosen caustic in the caustic method is shown in green.
Current usage metrics show cumulative count of Article Views (full-text article views including HTML views, PDF and ePub downloads, according to the available data) and Abstracts Views on Vision4Press platform.
Data correspond to usage on the plateform after 2015. The current usage metrics is available 48-96 hours after online publication and is updated daily on week days.
Initial download of the metrics may take a while.