Fig. 13
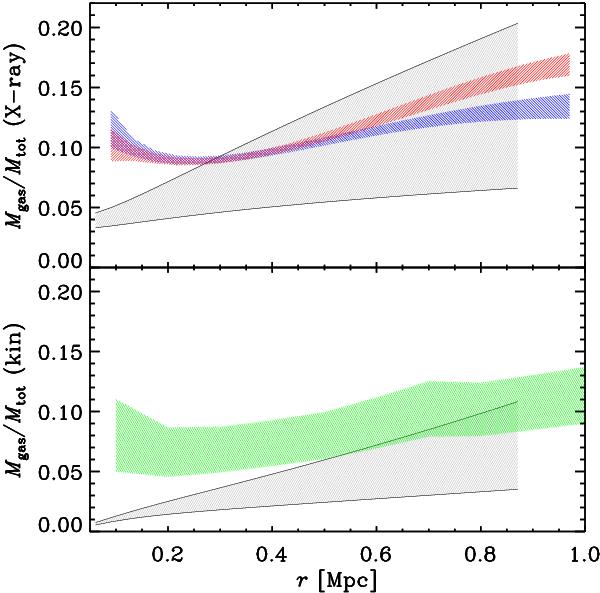
Top panel: ratio of gas mass to total mass from the X-ray analysis. The gray-shaded region within solid lines is the 1σ interval on the observed gas mass fraction of LCDCS 0504. The blue- and red-shaded regions (the blue one below the red one at large radii) are the average gas mass fractions for cool-core and non-cool-core clusters from Eckert et al. (2013). Bottom panel: ratio of gas mass to total mass, the latter derived from the kinematics analysis. The gray-shaded region within solid lines is the 1σ interval on the observed gas mass fraction of LCDCS 0504. The green-shaded region is the average gas mass fraction for nearby clusters from Biviano & Salucci (2006).
Current usage metrics show cumulative count of Article Views (full-text article views including HTML views, PDF and ePub downloads, according to the available data) and Abstracts Views on Vision4Press platform.
Data correspond to usage on the plateform after 2015. The current usage metrics is available 48-96 hours after online publication and is updated daily on week days.
Initial download of the metrics may take a while.