Fig. 12
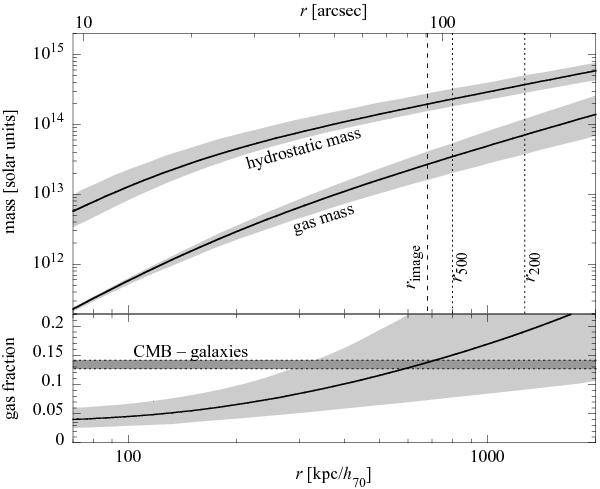
Top panel: intracluster gas mass profile (lower curve) and the hydrodynamical derived total mass radial profiles. The gray-shaded regions represent 1σ confidence levels. Vertical lines indicate rimage, the limit where the cluster is detected with the combined XMM data (using both exposures), and r500 and r200, computed from the X-ray derived mass profile. Bottom panel: gas mass fraction radial profile. As a reference we also show the universal gas fraction, as obtained by the cosmic baryon fraction Ωb/ Ωm value from WMAP-9yr (Hinshaw et al. 2013) and Planck 1st release (Planck Collaboration XVI 2014, including their uncertainties), reduced by 17%.
Current usage metrics show cumulative count of Article Views (full-text article views including HTML views, PDF and ePub downloads, according to the available data) and Abstracts Views on Vision4Press platform.
Data correspond to usage on the plateform after 2015. The current usage metrics is available 48-96 hours after online publication and is updated daily on week days.
Initial download of the metrics may take a while.