Fig. 11
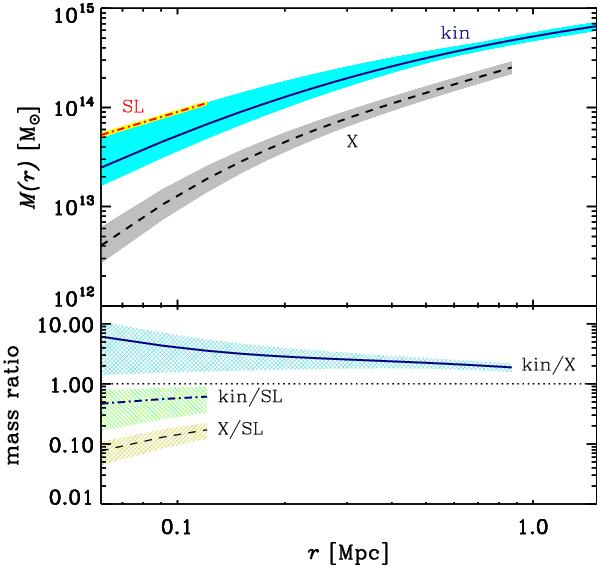
Top panel: mass profiles and their 1 σ confidence regions obtained from the SL (red dashed line and yellow region), X-ray (black dashed line and gray region), and kinematics (blue solid line and cyan region) analyses. Bottom panel: ratios of the three mass profiles and their 1σ confidence regions. Solid blue line and gray-cyan region: ratio of the kinematics to X-ray mass profiles. Dashed-dotted blue line and green region: ratio of the kinematics to SL mass profiles. Dashed black line and orange region: ratio of the X-ray to SL mass profiles. In both panels the profiles are shown in the radial range where they are constrained by the data.
Current usage metrics show cumulative count of Article Views (full-text article views including HTML views, PDF and ePub downloads, according to the available data) and Abstracts Views on Vision4Press platform.
Data correspond to usage on the plateform after 2015. The current usage metrics is available 48-96 hours after online publication and is updated daily on week days.
Initial download of the metrics may take a while.