Fig. 10
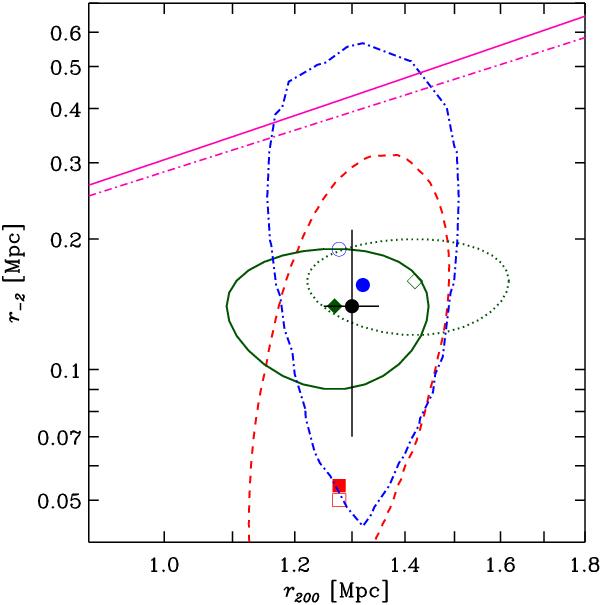
Best-fit M(r) NFW parameters from the kinematics analyses within 1σ confidence level contours, obtained with the DK (red squares), MAMPOSSt (blue dot and circle), and caustic methods (green filled and open diamond). The filled (open) symbols are for the solutions obtained using the rn value from the photometric (spectroscopic) sample of members. The dashed red (dash-dotted blue) contour represents the 1σ confidence region on the best-fit parameters of the DK (MAMPOSSt) method, obtained using the rn value from the photometric sample of members. The solid (dotted) green contour represents the 1σ confidence region on the best-fit parameters for the caustic method obtained using ℱβ = 0.5 (resp. ℱβ = 0.7). The magenta solid (dash-dotted) inclined line is the theoretical predictions for relaxed clusters at the mean redshift of LCDCS 0504 from Bhattacharya et al. (2013) (De Boni et al. 2013). The black dot with error bars is the weighted average of the DK, MAMPOSSt, and caustic results.
Current usage metrics show cumulative count of Article Views (full-text article views including HTML views, PDF and ePub downloads, according to the available data) and Abstracts Views on Vision4Press platform.
Data correspond to usage on the plateform after 2015. The current usage metrics is available 48-96 hours after online publication and is updated daily on week days.
Initial download of the metrics may take a while.