Fig. 4
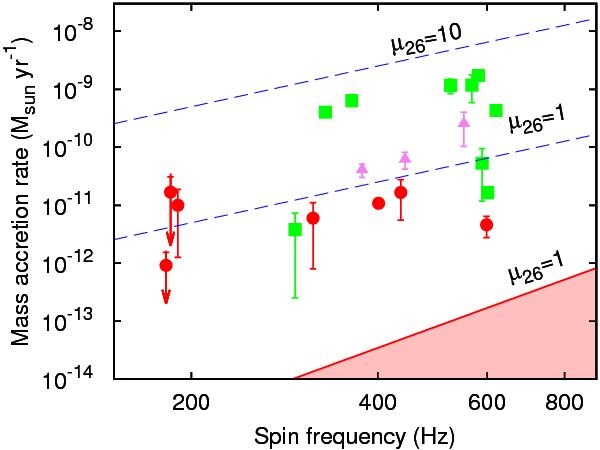
Long-term mass-accretion rate of millisecond pulsars in the accretion phase, as evaluated by Watts et al. (2008). Accreting-MSPs are plotted as red circles, nuclear MSPs as green squares. Magenta triangles mark the accreting MSPs that showed pulsations only intermittently, and that may have a magnetic field close to the threshold for field burial (Cumming 2008). Blue dashed lines represent the magnetic spin equilibrium lines defined by Eq. (1), evaluated for μ26 = 1 and μ26 = 10. The red shaded region defines the parameter space in which a source enters the radio ejector state for μ26 = 1 (e.g., Burderi et al. 2001).
Current usage metrics show cumulative count of Article Views (full-text article views including HTML views, PDF and ePub downloads, according to the available data) and Abstracts Views on Vision4Press platform.
Data correspond to usage on the plateform after 2015. The current usage metrics is available 48-96 hours after online publication and is updated daily on week days.
Initial download of the metrics may take a while.