| Issue |
A&A
Volume 565, May 2014
|
|
|---|---|---|
| Article Number | A114 | |
| Number of page(s) | 7 | |
| Section | Extragalactic astronomy | |
| DOI | https://doi.org/10.1051/0004-6361/201423884 | |
| Published online | 20 May 2014 | |
The rise and fall of the Type Ib supernova iPTF13bvn
Not a massive Wolf-Rayet star
1 Department of Astronomy, The Oskar Klein Center, Stockholm University, AlbaNova, 10691 Stockholm, Sweden
e-mail: This email address is being protected from spambots. You need JavaScript enabled to view it.
2 Las Cumbres Observatory Global Telescope Network, 6740 Cortona Dr., Suite 102, Goleta, CA 93117, USA
3 Department of Physics, University of California, Broida Hall, Mail Code 9530, Santa Barbara, CA 93106-9530, USA
4 Kavli Institute for Theoretical Physics, University of California, Santa Barbara, CA 93106, USA
5 Benoziyo Center for Astrophysics, The Weizmann Institute of Science, Rehovot 76100, Israel
6 Cahill Center for Astrophysics, California Institute of Technology, Pasadena, CA 91125, USA
7 Astrophysics Science Division, NASA Goddard Space Flight Center, Mail Code 661, Greenbelt, MD 20771, USA
8 Joint Space Science Institute, University of Maryland, College Park, MD 20742, USA
9 Department of Astronomy, University of California, Berkeley, CA 94720-3411, USA
Received: 26 March 2014
Accepted: 16 April 2014
Abstract
Context. We investigate iPTF13bvn, a core-collapse (CC) supernova (SN) in the nearby spiral galaxy NGC 5806. This object was discovered by the intermediate Palomar Transient Factory (iPTF) very close to the estimated explosion date and was classified as a stripped-envelope CC SN, likely of Type Ib. Furthermore, a possible progenitor detection in pre-explosion Hubble Space Telescope (HST) images was reported, making this the only SN Ib with such an identification. Based on the luminosity and color of the progenitor candidate, as well as on early-time spectra and photometry of the SN, it was argued that the progenitor candidate is consistent with a single, massive Wolf-Rayet (WR) star.
Aims. We aim to confirm the progenitor detection, to robustly classify the SN using additional spectroscopy, and to investigate if our follow-up photometric and spectroscopic data on iPTF13bvn are consistent with a single-star WR progenitor scenario.
Methods. We present a large set of observational data, consisting of multi-band light curves (UBVRI, g′r′i′z′) and optical spectra. We perform standard spectral line analysis to track the evolution of the SN ejecta. We also construct a bolometric light curve and perform hydrodynamical calculations to model this light curve to constrain the synthesized radioactive nickel mass and the total ejecta mass of the SN. Late-time photometry is analyzed to constrain the amount of oxygen. Furthermore, image registration of pre- and post-explosion HST images is performed.
Results. Our HST astrometry confirms the location of the progenitor candidate of iPTF13bvn, and follow-up spectra securely classify this as a SN Ib. We use our hydrodynamical model to fit the observed bolometric light curve, estimating the total ejecta mass to be 1.9 M⊙ and the radioactive nickel mass to be 0.05 M⊙. The model fit requires the nickel synthesized in the explosion to be highly mixed out in the ejecta. We also find that the late-time nebular r′-band luminosity is not consistent with predictions based on the expected oxygen nucleosynthesis in very massive stars.
Conclusions. We find that our bolometric light curve of iPTF13bvn is not consistent with the previously proposed single massive WR-star progenitor scenario. The total ejecta mass and, in particular, the late-time oxygen emission are both significantly lower than what would be expected from a single WR progenitor with a main-sequence mass of at least 30 M⊙.
Key words: supernovae: general / supernovae: individual: iPTF13bvn
© ESO, 2014
1. Introduction
Type Ibc core-collapse supernovae (CC SNe) have either had their envelopes stripped of hydrogen (SNe Ib) or stripped of both hydrogen and helium in the case of SNe Ic (e.g., Filippenko 1997). The mass loss could either be due to an extensive wind in a single massive star (Groh et al. 2014), or due to binary interaction (Yoon et al. 2010).
The discovery of iPTF13bvn was made by the intermediate Palomar Transient Factory (iPTF; Law et al. 2009) in the nearby1 galaxy NGC 5806 on 2013 June 16.24 (UT), just 0.57 days past the estimated explosion date (JD 2456459.17; Cao et al. 2013). Early-time spectra indicated a likely Type Ib classification. Furthermore, Cao et al. (2013) used adaptive optics (AO) images and Hubble Space Telescope (HST) pre-explosion archival images to show that there is a possible progenitor within 80 milliarcsec (mas) of the estimated location of the explosion. The luminosity and colors of this progenitor candidate are consistent with those of a single Wolf-Rayet (WR) star. Cao et al. (2013) further argue that the early-time light curves (LCs) and spectra in the optical and near-infrared, along with the mass-loss rate estimated from radio observations, are all consistent with a WR star as the progenitor.
WR stars are very massive, with zero-age main-sequence masses (MZAMS) easily surpassing 30 M⊙ (Maeder 1981; Crowther 2007). These stars have very strong winds, resulting in high mass-loss rates (Ṁ) sometimes even exceeding Ṁ ≈ 10-5 M⊙ yr-1. It is believed that the high mass-loss rate can cause the entire hydrogen envelope to be expelled before the star undergoes core collapse (Groh et al. 2013b, 2014). The result of this would then be a stripped-envelope Type Ib supernova.
Following the discovery and the possible progenitor detection, Groh et al. (2013a) used their Geneva stellar evolution models (Groh et al. 2013b, 2014) in combination with the radiative transfer code CMFGEN (Hillier & Miller 1998) to model iPTF13bvn. They conclude that the possible progenitor candidate detection and the early-time photometry and spectroscopy are compatible with a model where the progenitor of iPTF13bvn is a single WR star with a main-sequence mass of 32 M⊙.
In this paper, we expand on the discussion of iPTF13bvn. In Sect. 2 we describe our follow-up observations and give details of the data reduction. Section 3 provides a confirmation of the astrometric identification of the HST progenitor candidate. In Sect. 4 we present the filtered LCs and describe the construction of the bolometric LC of iPTF13bvn. We use semi-analytic arguments based on the model of Arnett (1982) and the methodology developed by Cano (2013) to show that the bolometric properties of the SN are not consistent with the progenitor being very massive (i.e., MZAMS> 30 M⊙). In Sect. 5 we report our follow-up spectroscopy, confirm the classification of iPTF13bvn as a SN Ib and provide velocity measurements of the SN ejecta. The latter are used in Sect. 6 together with the hydrodynamical model HYDE (Ergon et al., in prep.) to further constrain the synthesized nickel and ejecta masses of the explosion and the helium-core mass of the progenitor. In Sect. 5 we also use late-time photometry (>200 days past the explosion) to constrain the amount of oxygen in the ejecta by comparing our data to the detailed nebular modeling by Jerkstrand et al. (2014b). These results are also inconsistent with a very massive progenitor.
2. Observations and data reduction
The discovery of iPTF13bvn was made with the Palomar Oschin Schmidt 48-inch (P48) telescope. Cao et al. (2013) also reported follow-up photometry obtained with the P48, the robotic Palomar 60-inch telescope (P60; Cenko et al. 2006), and the Las Cumbres Observatory Global Telescope network (LCOGT; Brown et al. 2013) up to 20 days past the discovery. Here we present photometry from the same telescopes up to 90 days past discovery, as well as additional data from the Nordic Optical Telescope (NOT) at La Palma obtained around 240 days past discovery.
To produce LCs from the P48, P60, and NOT data, we have used an image-subtraction procedure with templates consisting of images of NGC 5806 obtained approximately one year before the discovery of iPTF13bvn. The point-spread function (PSF) is determined and matched prior to image subtraction, and is subsequently used for PSF fitting photometry on the subtracted frames. For the images obtained by LCOGT we lack templates, and thus we estimate the galaxy contribution by fitting a low-order surface, and then performing PSF fitting photometry. We calibrate our P48 and Sloan filter data against a minimum of 10 SDSS (Ahn et al. 2014) stars in the field. The Johnson-Cousins UBVRI filter data were calibrated against Landolt standard stars (Landolt 1992) observed during photometric nights.
Optical and near-infrared spectra of iPTF13bvn were obtained with many different telescopes and instruments, starting within 24 h after the discovery. Spectra until 16 days past the discovery were published by Cao et al. (2013). In this paper, we present 6 additional later-time optical spectra taken 18–86 days past the SN discovery. These were obtained with the Palomar 200-inch telescope (P200) using the Double Spectrograph (DBSP; Oke & Gunn 1982), with the NOT using the Andalucia Faint Object Spectrograph (ALFOSC), and with the two Keck 10 m telescopes using the Low Resolution Imaging Spectrograph (LRIS; Oke et al. 1995) on Keck 1 and the Deep Extragalactic Imaging Multi-Object Spectrograph (DEIMOS; Faber et al. 2003) on Keck 2.
All spectra were reduced using standard pipelines and procedures for each telescope and instrument. All spectral data and corresponding information is available via WISeREP2 (Yaron & Gal-Yam 2012). More data and details will be published by Fremling et al. (in prep.), where we will also investigate the explosion site of iPTF13bvn in more detail.
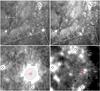 |
Fig. 1 Progenitor identification of iPTF13bvn based on registering an HST WFC3 image of the SN to a stacked archival pre-explosion HST ACS image. The left panels show an image taken when iPTF13bvn was clearly visible, and the panels to the right show the pre-explosion image. The field of view in the upper panels is 16″ × 16″. The location of the SN is marked by the grey dashed square in the upper panels, and the lower panels show this region in detail. Common point sources used for the registration are marked with boxed black circles. The intensity contours of the bright SN in the lower-left panel are traced with black dashed lines. The centroid of the SN is indicated with red circles in each panel; the smaller and larger red circles respectively represent 1σ and 5σ uncertainties in the registration. The lower-right panel shows the progenitor identification; the centroid of the SN is directly coincident with one object. |
3. Progenitor identification
A progenitor candidate for iPTF13bvn was identified in pre-explosion HST images by Cao et al. (2013)3. This was done by registering AO images taken with OSIRIS and the laser-guide-star-AO system on the Keck 1 telescope. Cao et al. (2013) present a single source offset by about 80 ± 40 mas from the SN position, barely within the estimated 2σ image-registration uncertainty. We have used recent archival HST (WFC3) images4 of iPTF13bvn to corroborate this identification. Figure 1 shows the result of registering a WFC3 image (filter F555W) to a stacked (filters F814W, F555W, and F435W) archival HST (ACS/WFC) image from 2005 (Smartt et al. 2009) using 25 common point sources.
Our registration procedure is based on standard MATLAB functions and is set up as follows. The centroids of the selected common point sources in the images are derived from fits of two-dimensional Gaussians that also allow for rotation; the geometric transformation is subsequently determined as a second-order polynomial transformation with 12 parameters, and the polynomial transformation is finally applied using bicubic interpolation. Using this procedure we achieve a standard deviation of 0.18 HST (ACS/WFC) pixels5 in the offset between the post-explosion centroids and the pre-explosion centroids after image registration. If we combine this standard deviation with the uncertainty in the centroid of the SN in the post-explosion image, we find a total (1σ) uncertainty of 9 mas in our determination of the location of iPTF13bvn, corresponding to a projected distance of 1 pc. We find that the center of the SN explosion is almost exactly coincident (+ 1.7 mas in α, + 3.6 mas in δ) with the centroid of the previously proposed progenitor candidate. Cao et al. (2013) reported the absolute (Vega) magnitudes for this source: MB = −5.52 ± 0.39, MV = −5.55 ± 0.39, and MI = −5.77 ± 0.41 mag. These are consistent with a single WR star (Eldridge et al. 2013; Groh et al. 2013a). However, Cao et al. (2013) also caution that other scenarios (e.g., a binary system, or a small cluster) can result in similar colors and absolute magnitudes.
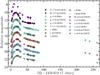 |
Fig. 2 Multi-band light curves of iPTF13bvn. Obtained with the P48 and P60 telescopes, the LCOGT telescopes, and the NOT. |
4. Light curves
The P48 r′-band pre-explosion limits and the optical LCs of iPTF13bvn are displayed in Fig. 2. We have constructed a quasi-bolometric LC6 by integrating the flux in the BVRI bands, and we have determined the black-body (BB) parameters of iPTF13bvn by fitting BBs to the spectral energy distribution (SED) derived from the full set of UBVRI and g′r′i′z′ LCs from the P60 and the LCOGT telescopes. For the quasi-bolometric LC calculation, we have interpolated the flux in the BVRI bands to the dates of the V-band measurements. For these calculations we adopt a distance modulus μ = 31.76 mag (Tully et al. 2009), a Milky Way (MW) color excess E(B − V)MW = 0.0278 mag (Schlafly & Finkbeiner 2011), a host-galaxy color excess E(B − V)host = 0.0437 mag (Cao et al. 2013), and the Cardelli et al. (1989) extinction law with RV = 3.1. For the BB fits we have also used weights proportional to the uncertainties in the photometry, and we have interpolated or linearly extrapolated the flux in the UBVRI and g′r′i′z′ bands to the dates of both the V- and r′-band measurements.
The quasi-bolometric LC and the BB parameters of iPTF13bvn are shown in Figs. 3 and 4, respectively. In Fig. 3 we also display the quasi-bolometric BVRI LC of the Type IIb SN 2011dh (Ergon et al. 2014a), as well as a scaled and stretched quasi-bolometric BVRI LC of SN 1998bw (SN Ic-BL; Clocchiatti et al. 2011). We find that the peak BVRI luminosity of iPTF13bvn is somewhat lower than that of SN 2011dh, indicating a slightly lower 56Ni mass7. Furthermore, the width of the LC peak appears to be narrower for iPTF13bvn than for both SNe 1998bw and 2011dh. The narrow peak already disfavors a massive single-star (WR) progenitor scenario, since such a massive progenitor (i.e., MZAMS ≳ 30 M⊙) should have a large ejecta mass resulting in a slower evolution of the bolometric LC with a broader peak (Arnett 1982).
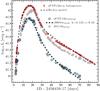 |
Fig. 3 Quasi-bolometric BVRI LC of iPTF13bvn (blue circles), compared to the quasi-bolometric LCs of SN 2011dh (gray circles) and SN 1998bw (thick dashed line). The LC of SN 1998bw has been scaled by k = 0.125 and stretched by s = 0.82. The figure also shows the estimated bolometric LC of iPTF13bvn (red circles) compared with our hydrodynamical model of the bolometric LC (thin dashed line). |
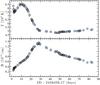 |
Fig. 4 Black-body temperature (top panel) and black-body radius (bottom panel) of iPTF13bvn derived from BB fits to the photometry. |
We find that the BVRI LC of SN 1998bw, multiplied by the scaling factor k = 0.125 and stretched by the factor s = 0.82 using  (1)is very well matched with our BVRI LC of iPTF13bvn. These parameter values were found by varying s and k and minimizing the residual between the two SN LCs up to 40 days past the estimated explosion dates. Interpolating the s and k factors found for the sample of SNe Ibc in Cano (2013) provides8M56Ni = 0.05 ± 0.02 M⊙ and Mej = 1.8 ± 0.3 M⊙. These interpolations only include SNe with photospheric velocities in the range 7000−11 000 km s-1, to roughly match the velocities derived from the early-time spectra of iPTF13bvn in Cao et al. (2013), and also in later spectra (Sect. 5). A comparison of our derived masses for iPTF13bvn to the median nickel mass (M56Ni = 0.15 − 0.18 M⊙) and ejecta mass (Mej = 3.9 ± 1.6 M⊙) of the full SN Ibc sample in Cano (2013) indicates that iPTF13bvn has a lower 56Ni mass and also likely a lower ejecta mass than the average SN Ibc.
From our black-body fits to the SED of iPTF13bvn we derive the best-fitting BB radius (RBB) and temperature (TBB) as a function of time. We show the evolution of RBB, which can be interpreted as a rough approximation of the photospheric radius, in the bottom panel of Fig. 4. The best-fitting TBB is shown in the top panel of Fig. 4. Both RBB and TBB are similar to those of SN 2011dh (Ergon et al. 2014a), with TBB peaking at ~8500 K and RBB peaking at ~1.4 × 1015 cm for both objects. Compared to the larger sample of SNe Ibc presented by Taddia et al. (2014), both TBB and RBB appear to be consistent with those of normal SNe Ibc. If RBB is linearly extrapolated to RBB = 0, we find an explosion date (t0) of 2013 June 15.75 ± 0.3 (UT), consistent with the t0 estimate of June 15.67 by Cao et al. (2013) using a power-law fit to the early-time r′-band LC.
5. Spectra
Cao et al. (2013) suggested a Type Ib classification of iPTF13bvn, partly based on the tentative emergence of He i features (5876, 6678, 7065 Å) in optical spectra obtained 10−15 days past explosion. Our later-time optical spectra clearly demonstrate the continued emergence of these features (Fig. 6), as well as of the He i 5016 Å line. At ~35 days past explosion, we find a very good match between the spectra of iPTF13bvn and those of the Type Ib SNe 2008D (Modjaz et al. 2009) and 2007Y (Stritzinger et al. 2009) (bottom panel of Fig. 6). Thus, it is clear that the Type Ib spectral classification holds.
SYNOW fits were performed by Cao et al. (2013) on the early-time spectra of iPTF13bvn, suggesting a photospheric velocity (vph) of 10 000 km s-1 at +3 d and 8000 km s-1 at +12 d. To deduce the photospheric velocity, the absorption minimum of the Fe ii 5169 Å line is likely a more robust tracer (Dessart & Hillier 2005). We detect the absorption minimum from this line in spectra later than +10 d post-explosion, and show the deduced photospheric velocities in Fig. 5. We find vph ≈ 10 000 km s-1 at +10 d, in agreement with the 8000–10 000 km s-1 estimate by Cao et al. (2013). Figure 5 also shows the photospheric velocity deduced from BB fits to the photometry (Sect. 4), as well as line velocities from the absorption minimum of the He i 5876, 6678, 7065 Å lines. Typical uncertainties in the velocity estimates are 15% before 15 d past the explosion and 5–10% at later times. Up until +10 d the different velocity estimates appear to be in good agreement. At later stages, especially the He i 5876 Å velocity starts to deviate, and ceases to be a useful tracer. Similar behavior was observed for SN 2011dh (Ergon et al. 2014a). In conclusion, we confirm that a photospheric velocity of 8000–10 000 km s-1 during the LC peak of iPTF13bvn is a reasonable estimate. For our hydrodynamical model of the SN in Sect. 6 we use the He i 5876 Å line as a tracer up until +10 d and thereafter the Fe ii 5169 Å line up until +40 d.
5.1. Constraining the oxygen mass
Our optical spectra at epochs later than +50 d show a clear emergence of O i features (5577, 6300, 6364, and 7774 Å). For the massive single-star progenitor scenario proposed by Groh et al. (2013a), a large O mass is expected, and our observations allow us to test this.
The concept here is the realization that more massive stars produce larger amounts of metals, and in particular the oxygen nucleosynthesis is a strong and monotonic function of MZAMS (Woosley & Heger 2007). This was exploited by Jerkstrand et al. (2014a), who find a strong dependence between the ratio (Or) of the [O i] 6300, 6364 Å line luminosity to the total 56Co decay power, and MZAMS of SNe IIP (see, e.g., the top panel of Fig. 4 in Jerkstrand et al. 2014a). More recently, Jerkstrand et al. (2014b) have also modeled nebular stripped-envelope CC SNe, and a similar strong dependence between Or and MZAMS was found. Our spectrum obtained at +86 d is likely not yet in the optically thin nebular phase. However, the [O i] 6300, 6364 Å line luminosity we measure at this phase is consistent with that of SN 2011dh, which likely was the result of the explosion of a 12–13 M⊙MZAMS star with an oxygen mass of 0.3–0.5 M⊙ at the time of the explosion (Jerkstrand et al. 2014b)9.
Lacking spectra of iPTF13bvn in the nebular phase, we can instead use the r′-band photometry from the NOT obtained at +227 d, +240 d, and +262 d. Under the (conservative) assumption that all of the r′-band flux is due to the [O i] lines and with M56Ni = 0.05 M⊙, we find Or ≈ 0.018 at +227 d, Or ≈ 0.017 at +240 d and Or ≈ 0.015 at +262 d. For SN 2011dh the corresponding values are in the range Or ≈ 0.012–0.08, as derived from spectral observations between +200 d to +300 d. For stars with MZAMS significantly higher than that of SN 2011dh, much higher values for Or are predicted; for example, Or ≈ 0.035 for MZAMS = 17 M⊙ (Jerkstrand et al. 2014b). Thus, we find that the late-time oxygen line luminosity of iPTF13bvn is not consistent with that expected from the MZAMS = 32 M⊙ progenitor suggested by Groh et al. (2013a).
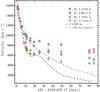 |
Fig. 5 Line velocities of iPTF13bvn derived from absorption minima in the spectra (colored circles), the photospheric velocity derived from BB fits to the photometry (thick dashed line) and the photospheric velocity of iPTF13bvn modeled by our hydrodynamical code (thin dashed line). |
6. Light curve modeling and progenitor constraints
The semi-analytic framework of Piro & Nakar (2013), in combination with early-time observations, was used by Cao et al. (2013) to constrain the radius of the progenitor of iPTF13bvn to a few solar radii. Furthermore, the HST progenitor candidate detection and the deduced mass-loss rate by Cao et al. (2013) led to the conclusion by both Cao et al. (2013) and Groh et al. (2013a) that the progenitor of iPTF13bvn was consistent with a compact WR star. However, in the previous sections we have used semi-analytic arguments regarding the bolometric LC, as well as nebular oxygen emission considerations, to show that our post-peak data are inconsistent with a massive (>30 M⊙) single-star progenitor. In this section, we attempt to more robustly constrain some of the properties of the progenitor of iPTF13bvn using a hydrodynamical model for the bolometric LC.
We use our observed multi-band UBVRI and g′r′i′z′ LCs of iPTF13bvn, the explosion date estimate by Cao et al. (2013) as an initial guess for the explosion time, and our measured photospheric velocities together with a grid of SN models constructed with the hydrodynamical code HYDE, previously used to model the first 100 days of the bolometric LCs of SNe 1993J, 2008ax, and 2011dh (Ergon et al., in prep.). The code is one-dimensional, based on flux-limited diffusion, and follows the framework described by Falk & Arnett (1977)10. The model grid is based on bare He cores evolved until the verge of core collapse using MESA11 (Paxton et al. 2010). For the infrared and ultraviolet regions we use bolometric corrections derived from the bolometric LC of SN 2011dh. When we perform the fits to our model grid, we place equal weights on the diffusion phase of the LC (+1 d to +40 d), the early tail of the LC (+40 d to +100 d), and the photospheric velocity measurements (+2 d to +40 d).
The best-fitting model, shown in Fig. 3 along with the estimated bolometric LC, constrains the total energy of the explosion to be  erg, the synthesized radioactive nickel mass to be
  M⊙, and the total ejecta mass to be
  M⊙ under the assumption that a 1.5 M⊙ remnant remains at the center of the SN explosion. The total mass of the He core before the explosion in the model is thus
  M⊙. The best-fitting explosion time (tb) is 2013 June 15.55 (UT). The ejecta mass we find is much lower than what is suggested by the Groh et al. (2013a) massive single star progenitor scenario, which requires12Mej ≈ 8 − 9 M⊙ assuming a 2−3 M⊙ remnant. We also find that to fit the early rise of the LC up to 10 d past the explosion, our model requires the radioactive nickel synthesized in the explosion to be highly mixed out in the ejecta. If the nickel is concentrated toward the center, the diffusion time becomes too large, and the rise of the model LC happens too late to fit the fast rise of the observed early LC. The reported errors are propagated from the observed quantities; we assume an uncertainty in the distance modulus to NGC 5806 of ± 0.3 mag, an uncertainty in the total extinction for iPTF13bvn of ± 0.045 mag, and uncertainties in the photospheric velocities of ± 15%.
We note that our model is generally able to achieve an excellent fit to the observed data, including the peak and the tail of the LC as well as the photospheric velocities13. Furthermore, if we let the final explosion time vary between the time of the first non-detection until the first detection in the r′-band, we find that, while the quality of the fit is decreased (especially for dates earlier than tb − 0.25 d), the high nickel-mixing requirement always remains and the derived explosion parameters are not significantly changed. In this sense, our  and Mej estimates are quite robust, and we note that they are also very similar to the semi-analytic nickel and ejecta masses derived in Sect. 4.
We also note that the radius constraint of a few solar radii on the progenitor of iPTF13bvn by Cao et al. (2013) was partly based on assumed typical explosion parameters for a SN Ib. Our model does not directly constrain the radius; it is constant across the models in our grid. However, the explosion parameters we derive permit a larger radius of the progenitor within the Piro & Nakar (2013) semi-analytic framework.
7. Summary and conclusions
We have confirmed the classification of iPTF13bvn as a Type Ib SN, and also that the pre-explosion HST progenitor identification suggested by Cao et al. (2013) is very likely correct (Sect. 3). While the color and luminosity of the progenitor in the HST images are consistent with those of a WR star, we have shown that the later-time photometry (Sect. 4) of iPTF13bvn is not consistent with a single, very massive WR progenitor scenario. Our hydrodynamical model can fit the observed bolometric light curve to constrain the total ejecta mass to be ~1.9 M⊙. The corresponding mass of the He core of the progenitor is ~3.4 M⊙ immediately prior to the explosion. The synthesized nickel mass is constrained to be ~0.05 M⊙. The model also requires the synthesized nickel to be highly mixed out in the ejecta, consistent with the high average mixing found for the sample of SNe Ibc by Taddia et al. (2014). The total ejecta mass and our limits on the late-time oxygen emission are both inconsistent with what would be expected from a single massive WR progenitor with MZAMS ≈ 30 M⊙ as suggested by Groh et al. (2013a). We note that while it could be argued that a significant part of the He core could fall back onto the central compact object, such a scenario that still produces an apparently nickel-powered LC, normal observed photospheric velocities, and the measured oxygen emission appears unlikely. We also note that while the deduced high mass-loss rate was interpreted by Groh et al. (2013a) as favoring a massive WR star, the mass-loss estimate depends on an assumed high stellar wind velocity. A lower wind velocity in combination with the radio measurements of Cao et al. (2013) can also be consistent with a less massive star.
To date, the SN Ibc showing the largest deviation in LC shape compared to the typical SN Ibc LC (e.g., Drout et al. 2011; Taddia et al. 2014) is the bolometric LC of SN Ic 2011bm presented by Valenti et al. (2012). SN 2011bm has a very high peak luminosity and (most importantly) a very slow evolution of the bolometric LC and a broad peak, which is difficult to explain without assuming a very high (>30 M⊙) main-sequence mass for the progenitor. This is the kind of SN LC we would expect from a scenario including the very massive progenitor star suggested by Groh et al. (2013a). It is clear that the bolometric LC of iPTF13bvn is very different from that of SN 2011bm.
If the progenitor is less massive, a binary system for the progenitor is perhaps the most natural conclusion. Using the progenitor constraints from our hydrodynamical model, the evolutionary models for binary systems by Yoon et al. (2010) predict values for the radius, mass-loss rate, and hydrogen content in the progenitor that are all consistent with what can be derived from the early-time observations by Cao et al. (2013). In contrast, current single-star evolutionary synthesis models (e.g., Groh et al. 2013b) have a harder time producing a progenitor with a sufficiently low mass to match the observed properties; stars with low enough ZAMS masses to explain the low ejecta mass, as well as the observed nebular oxygen emission constraints, are not predicted to produce SNe Ibc in this context.
The ultimate test to assess the nature of the progenitor will be to reobserve the location of iPTF13bvn with HST after the SN has faded. A single massive WR progenitor scenario predicts that the progenitor candidate would completely disappear, while a less massive progenitor in a binary system would lead to a smaller decrease in the luminosity at the location of the progenitor.
Finally, we emphasize that the use of the new Jerkstrand et al. (2014b) nebular modeling in conjunction with photometry during the nebular phase could be an efficient way to constrain the ZAMS masses for a larger sample of stripped-envelope CC SNe. Future studies of nebular spectra of iPTF13bvn are planned, and we are also performing a detailed investigation of the host environment of the SN (Fremling et al., in prep.).
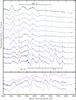 |
Fig. 6 Spectral evolution of iPTF13bvn in the wavelength range 4000−8000 Å (top panel). Comparison of the visible spectra of iPTF13bvn to those of other SNe Ib at approximately 35 d past the explosion (bottom panel). Thick dashed lines mark the central wavelength of the marked emission lines at rest. Thin dashed lines mark the absorption minima associated with the emission lines derived from Gaussian fits to the absorption features. The spectra up to 16 d past the explosion have been selected from the early spectral sequence presented by Cao et al. (2013). |
d = 22.5 Mpc, μ = 31.76 mag (Tully et al. 2009).
First reported in ATels 5140 and 5152 (Arcavi et al. 2013a,b).
Obtained on 2013 Sep. 2.37 (UT), GO-12888, PI S. Van Dyk.
The HST images used here have a pixel scale of 50 mas.
We construct a full bolometric LC and a hydrodynamical model of the LC in Sect. 6.
56Ni mass estimates for SN 2011dh are 0.075 ± 0.025 M⊙ by Ergon et al. (2014a) and ~0.07 M⊙ by Shivvers et al. (2013).
Cano (2013) assume a constant opacity, κ = 0.07 cm2 g-1, in the calculations of the physical parameters of the SNe in their sample.
The nebular spectrum of SN 2011dh has also been modeled by Shivvers et al. (2013) who find MZAMS = 13–15 M⊙ with an oxygen mass of approximately 0.3 M⊙ at the time of explosion.
After the submission of this paper, another paper on iPTF13bvn (Bersten et al. 2014) has also appeared. Similar hydrodynamical modeling is performed, showing consistent results.
The total He-core mass of the progenitor proposed by Groh et al. (2013a) immediately prior to the explosion is 10.9 M⊙.
We do not fit for the photospheric velocities at times later than +40 d. Our model of the photosphere is not applicable at these times.
Acknowledgments
The Oskar Klein Centre is funded by the Swedish Research Council. This work is partially based on observations made with the Nordic Optical Telescope, operated by the Nordic Optical Telescope Scientific Association at the Observatorio del Roque de los Muchachos, La Palma, Spain, of the Instituto de Astrofisica de Canarias. The data presented here were obtained in part with ALFOSC, which is provided by the Instituto de Astrofisica de Andalucia (IAA) under a joint agreement with the University of Copenhagen and NOTSA. Some of the data presented herein were obtained at the W. M. Keck Observatory, which is operated as a scientific partnership among the California Institute of Technology, the University of California, and NASA; the observatory was made possible by the generous financial support of the W. M. Keck Foundation. A. G.-Y. is supported by the EU/FP7 via ERC grant 307260, “The Quantum Universe” I-Core program by the Israeli Committee for planning and budgeting, by ISF, GIF, and Minerva grants, and by the Kimmel award. A. V. F.’s group at UC Berkeley has received generous financial assistance from the Christopher R. Redlich Fund, the TABASGO Foundation, NSF grant AST-1211916, and NASA grants AR-12623 and AR-12850 from the Space Telescope Science Institute (which is operated by AURA, Inc., under NASA contract NAS 5-26555). We extend our thanks to the following people for their various contributions to this work: Shri Kulkarni, Mansi M. Kasliwal, Ofer Yaron, Paul Vreeswijk, Daniel Perley, Joel Johansson, Anders Jerkstrand, Kelsey Clubb, Ori Fox, Patrick Kelly, Barak Zackay, Adam Waszczak, Donald O’Sullivan, and Thomas Augusteijn.
References
- Ahn, C. P., Alexandroff, R., Allen de Prieto, C., et al. 2014, ApJS, 211, 17 [NASA ADS] [CrossRef] [Google Scholar]
- Arcavi, I., Ofek, E., Cao, Y., et al. 2013a, ATel, 5152, 1 [NASA ADS] [Google Scholar]
- Arcavi, I., Yaron, O., Gal-Yam, A., & Cao, Y. 2013b, ATel, 5140, 1 [NASA ADS] [Google Scholar]
- Arnett, W. D. 1982, ApJ, 253, 785 [NASA ADS] [CrossRef] [Google Scholar]
- Bersten, M. C., Benvenuto, O. G., Folatelli, G., et al. 2014, ApJ, submitted [arXiv:1403.7288] [Google Scholar]
- Brown, T. M., Baliber, N., Bianco, F. B., et al. 2013, PASP, 125, 1031 [NASA ADS] [CrossRef] [Google Scholar]
- Cano, Z. 2013, MNRAS, 434, 1098 [NASA ADS] [CrossRef] [Google Scholar]
- Cao, Y., Kasliwal, M. M., Arcavi, I., et al. 2013, ApJ, 775, L7 [NASA ADS] [CrossRef] [Google Scholar]
- Cardelli, J. A., Clayton, G. C., & Mathis, J. S. 1989, ApJ, 345, 245 [NASA ADS] [CrossRef] [Google Scholar]
- Cenko, S. B., Fox, D. B., Moon, D.-S., et al. 2006, PASP, 118, 1396 [NASA ADS] [CrossRef] [Google Scholar]
- Clocchiatti, A., Suntzeff, N. B., Covarrubias, R., & Candia, P. 2011, AJ, 141, 163 [NASA ADS] [CrossRef] [Google Scholar]
- Crowther, P. A. 2007, ARA&A, 45, 177 [NASA ADS] [CrossRef] [Google Scholar]
- Dessart, L., & Hillier, D. J. 2005, A&A, 439, 671 [NASA ADS] [CrossRef] [EDP Sciences] [Google Scholar]
- Drout, M. R., Soderberg, A. M., Gal-Yam, A., et al. 2011, ApJ, 741, 97 [NASA ADS] [CrossRef] [Google Scholar]
- Eldridge, J. J., Fraser, M., Smartt, S. J., Maund, J. R., & Crockett, R. M. 2013, MNRAS, 436, 774 [NASA ADS] [CrossRef] [Google Scholar]
- Ergon, M., Sollerman, J., Fraser, M., et al. 2014a, A&A, 562, A17 [NASA ADS] [CrossRef] [EDP Sciences] [Google Scholar]
- Faber, S. M., Phillips, A. C., Kibrick, R. I., et al. 2003, in Instrument Design and Performance for Optical/Infrared Ground-based Telescopes, eds. M. Iye, & A. F. M. Moorwood, SPIE Conf. Ser., 4841, 1657 [Google Scholar]
- Falk, S. W., & Arnett, W. D. 1977, ApJS, 33, 515 [NASA ADS] [CrossRef] [Google Scholar]
- Filippenko, A. V. 1997, ARA&A, 35, 309 [NASA ADS] [CrossRef] [Google Scholar]
- Groh, J. H., Georgy, C., & Ekström, S. 2013a, A&A, 558, L1 [NASA ADS] [CrossRef] [EDP Sciences] [Google Scholar]
- Groh, J. H., Meynet, G., Georgy, C., & Ekström, S. 2013b, A&A, 558, A131 [NASA ADS] [CrossRef] [EDP Sciences] [Google Scholar]
- Groh, J. H., Meynet, G., Ekström, S., & Georgy, C. 2014, A&A, 564, A30 [NASA ADS] [CrossRef] [EDP Sciences] [Google Scholar]
- Hillier, D. J., & Miller, D. L. 1998, ApJ, 496, 407 [NASA ADS] [CrossRef] [Google Scholar]
- Jerkstrand, A., Smartt, S. J., Fraser, M., et al. 2014a, MNRAS, 439, 3694 [NASA ADS] [CrossRef] [Google Scholar]
- Jerkstrand, A., Ergon, M., Smartt, S., et al. 2014b, A&A, submitted [Google Scholar]
- Landolt, A. U. 1992, AJ, 104, 340 [NASA ADS] [CrossRef] [Google Scholar]
- Law, N. M., Kulkarni, S. R., Dekany, R. G., et al. 2009, PASP, 121, 1395 [NASA ADS] [CrossRef] [Google Scholar]
- Maeder, A. 1981, A&A, 99, 97 [NASA ADS] [Google Scholar]
- Modjaz, M., Li, W., Butler, N., et al. 2009, ApJ, 702, 226 [NASA ADS] [CrossRef] [Google Scholar]
- Oke, J. B., & Gunn, J. E. 1982, PASP, 94, 586 [NASA ADS] [CrossRef] [Google Scholar]
- Oke, J. B., Cohen, J. G., Carr, M., et al. 1995, PASP, 107, 375 [NASA ADS] [CrossRef] [Google Scholar]
- Paxton, B., Bildsten, L., Dotter, A., et al. 2010, MESA: Modules for Experiments in Stellar Astrophysics, Astrophysics Source Code Library, ascl:1010.083 [Google Scholar]
- Piro, A. L., & Nakar, E. 2013, ApJ, 769, 67 [NASA ADS] [CrossRef] [Google Scholar]
- Schlafly, E. F., & Finkbeiner, D. P. 2011, ApJ, 737, 103 [NASA ADS] [CrossRef] [Google Scholar]
- Shivvers, I., Mazzali, P., Silverman, J. M., et al. 2013, MNRAS, 436, 3614 [NASA ADS] [CrossRef] [Google Scholar]
- Smartt, S. J., Eldridge, J. J., Crockett, R. M., & Maund, J. R. 2009, MNRAS, 395, 1409 [NASA ADS] [CrossRef] [Google Scholar]
- Stritzinger, M., Mazzali, P., Phillips, M. M., et al. 2009, ApJ, 696, 713 [NASA ADS] [CrossRef] [Google Scholar]
- Taddia, F., Sollerman, J., Leloudas, G., et al. 2014, A&A, submitted [Google Scholar]
- Tully, R. B., Rizzi, L., Shaya, E. J., et al. 2009, AJ, 138, 323 [NASA ADS] [CrossRef] [Google Scholar]
- Valenti, S., Taubenberger, S., Pastorello, A., et al. 2012, ApJ, 749, L28 [NASA ADS] [CrossRef] [Google Scholar]
- Woosley, S. E., & Heger, A. 2007, Phys. Rep., 442, 269 [NASA ADS] [CrossRef] [Google Scholar]
- Yaron, O., & Gal-Yam, A. 2012, PASP, 124, 668 [NASA ADS] [CrossRef] [Google Scholar]
- Yoon, S.-C., Woosley, S. E., & Langer, N. 2010, ApJ, 725, 940 [NASA ADS] [CrossRef] [Google Scholar]
All Figures
|
Fig. 1 Progenitor identification of iPTF13bvn based on registering an HST WFC3 image of the SN to a stacked archival pre-explosion HST ACS image. The left panels show an image taken when iPTF13bvn was clearly visible, and the panels to the right show the pre-explosion image. The field of view in the upper panels is 16″ × 16″. The location of the SN is marked by the grey dashed square in the upper panels, and the lower panels show this region in detail. Common point sources used for the registration are marked with boxed black circles. The intensity contours of the bright SN in the lower-left panel are traced with black dashed lines. The centroid of the SN is indicated with red circles in each panel; the smaller and larger red circles respectively represent 1σ and 5σ uncertainties in the registration. The lower-right panel shows the progenitor identification; the centroid of the SN is directly coincident with one object. |
| In the text | |
|
Fig. 2 Multi-band light curves of iPTF13bvn. Obtained with the P48 and P60 telescopes, the LCOGT telescopes, and the NOT. |
| In the text | |
|
Fig. 3 Quasi-bolometric BVRI LC of iPTF13bvn (blue circles), compared to the quasi-bolometric LCs of SN 2011dh (gray circles) and SN 1998bw (thick dashed line). The LC of SN 1998bw has been scaled by k = 0.125 and stretched by s = 0.82. The figure also shows the estimated bolometric LC of iPTF13bvn (red circles) compared with our hydrodynamical model of the bolometric LC (thin dashed line). |
| In the text | |
|
Fig. 4 Black-body temperature (top panel) and black-body radius (bottom panel) of iPTF13bvn derived from BB fits to the photometry. |
| In the text | |
|
Fig. 5 Line velocities of iPTF13bvn derived from absorption minima in the spectra (colored circles), the photospheric velocity derived from BB fits to the photometry (thick dashed line) and the photospheric velocity of iPTF13bvn modeled by our hydrodynamical code (thin dashed line). |
| In the text | |
|
Fig. 6 Spectral evolution of iPTF13bvn in the wavelength range 4000−8000 Å (top panel). Comparison of the visible spectra of iPTF13bvn to those of other SNe Ib at approximately 35 d past the explosion (bottom panel). Thick dashed lines mark the central wavelength of the marked emission lines at rest. Thin dashed lines mark the absorption minima associated with the emission lines derived from Gaussian fits to the absorption features. The spectra up to 16 d past the explosion have been selected from the early spectral sequence presented by Cao et al. (2013). |
| In the text | |
Current usage metrics show cumulative count of Article Views (full-text article views including HTML views, PDF and ePub downloads, according to the available data) and Abstracts Views on Vision4Press platform.
Data correspond to usage on the plateform after 2015. The current usage metrics is available 48-96 hours after online publication and is updated daily on week days.
Initial download of the metrics may take a while.