| Issue |
A&A
Volume 565, May 2014
|
|
|---|---|---|
| Article Number | L10 | |
| Number of page(s) | 4 | |
| Section | Letters | |
| DOI | https://doi.org/10.1051/0004-6361/201423812 | |
| Published online | 26 May 2014 | |
On binary-driven hypernovae and their nested late X-ray emission
1 Dip. di Fisica and ICRA, Sapienza Università di Roma, piazzale Aldo Moro 5, 00185 Rome, Italy
e-mail: This email address is being protected from spambots. You need JavaScript enabled to view it.
2 ICRANet, piazza della Repubblica 10, 65122 Pescara, Italy
3 Université de Nice Sophia Antipolis, CEDEX 2, Grand Château Parc Valrose, BP 2135, 06103 Nice, France
4 ICRANet-Rio, Centro Brasileiro de Pesquisas Fisicas, rua Dr. Xavier Sigaud 150, 22290-180 Rio de Janeiro, Brazil
Received: 14 March 2014
Accepted: 28 April 2014
Abstract
Context. The induced gravitational collapse (IGC) paradigm addresses the very energetic (1052–1054 erg) long gamma-ray bursts (GRBs) associated to supernovae (SNe). Unlike the traditional “collapsar” model, an evolved FeCO core with a companion neutron star (NS) in a tight binary system is considered as the progenitor. This special class of sources, here named “binary-driven hypernovae” (BdHNe), presents a composite sequence composed of four different episodes with precise spectral and luminosity features.
Aims. We first compare and contrast the steep decay, the plateau, and the power-law decay of the X-ray luminosities of three selected BdHNe (GRB 060729, GRB 061121, and GRB 130427A). Second, to explain the different sizes and Lorentz factors of the emitting regions of the four episodes, for definiteness, we use the most complete set of data of GRB 090618. Finally, we show the possible role of r-process, which originates in the binary system of the progenitor.
Methods. We compare and contrast the late X-ray luminosity of the above three BdHNe. We examine correlations between the time at the starting point of the constant late power-law decay t*a, the average prompt luminosity ⟨ Liso ⟩, and the luminosity at the end of the plateau La. We analyze a thermal emission (~ 0.97–0.29 keV), observed during the X-ray steep decay phase of GRB 090618.
Results. The late X-ray luminosities of the three BdHNe, in the rest-frame energy band 0.3–10 keV, show a precisely constrained “nested” structure. In a space–time diagram, we illustrate the different sizes and Lorentz factors of the emitting regions of the three episodes. For GRB 090618, we infer an initial dimension of the thermal emitter of ~ 7 × 1012 cm, expanding at Γ ≈ 2. We find tighter correlations than the Dainotti-Willingale ones.
Conclusions. We confirm a constant slope power-law behavior for the late X-ray luminosity in the source rest frame, which may lead to a new distance indicator for BdHNe. These results, as well as the emitter size and Lorentz factor, appear to be inconsistent with the traditional afterglow model based on synchrotron emission from an ultra-relativistic (Γ ~ 102–103) collimated jet outflow. We argue, instead, for the possible role of r-process, originating in the binary system, to power the mildly relativistic X-ray source.
Key words: supernovae: general / binaries: general / gamma-ray burst: general / black hole physics / stars: neutron / nuclear reactions, nucleosynthesis, abundances
© ESO, 2014
1. Introduction
The induced gravitational collapse (IGC) paradigm has been widely illustrated (Ruffini et al. 2006, 2007, 2008; Rueda & Ruffini 2012; Izzo et al. 2012a). It assumes that long, energetic (1052–1054 erg) gamma-ray bursts (GRBs) associated to supernovae (SNe) originate in a close binary system composed of an evolved massive star (likely a FeCO core) in the latest phases of its thermonuclear evolution and a neutron star (NS) companion. From an observational point of view, the complete time sequence of the IGC paradigm binary system has been identified in GRB 090618 (Izzo et al. 2012b), GRB 101023 (Penacchioni et al. 2012), GRB 110907B (Penacchioni et al. 2013), and GRB 970828 (Ruffini et al. 2013). We name these especially energetic systems, here, fulfilling the IGC paradigm, “binary-driven hypernovae” (BdHNe), to differentiate them from the traditional less energetic hypernovae.
In this Letter we introduce the IGC paradigm space-time diagram for the four distinct emission episodes (see Fig. 1): Episode 1 corresponds to the onset of the FeCO core SN explosion, creating a new-NS (ν-NS, see A). Part of the SN ejecta triggers an accretion process onto the NS companion (see Rueda & Ruffini 2012; Izzo et al. 2012a, and B in Fig. 1), and a prolonged interaction between the ν-NS and the NS binary companion occurs (C). This leads to a spectrum with an expanding thermal component plus an extra power law (see Fig. 16 in Izzo et al. 2012b, and Fig. 4 in Ruffini et al. 2013). Episode 2 occurs when the companion NS reaches its critical mass and collapses to a black hole (BH), emitting the GRB (D) with Lorentz factors Γ ≈ 102–103 (for details, see e.g. Ruffini et al. 2010; Izzo et al. 2012b; Ruffini et al. 2013). Episode 3, observed in the X-rays, shows very precise behavior consisting of a steep decay, starting at the end point of the prompt emission (see E), and then a plateau phase, followed by a late constant power-law decay (see, e.g., Izzo et al. 2012b; Penacchioni et al. 2012; Ruffini et al. 2013). Episode 4, not shown in Fig. 1, corresponds to the optical SN emission due to the 56Ni decay (see Arnett 1996) occurring after ~ 10–15 days in the cosmological rest frame. In all BdHNe, the SN appears to have the same luminosity as in the case of SN 1998bw (Amati et al. 2007). Although the presence of the SN is implicit in all the sources fulfilling the IGC paradigm, it is only detectable for GRBs at z ≲ 1, in view of the limitations of the current optical telescopes.
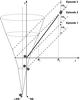 |
Fig. 1 IGC space–time diagram (not in scale) illustrates the relativistic motion of Episode 2 (Γ ≈ 500, thick line) and the non-relativistic Episode 1 (Γ ≈ 1) and Episode 3 (Γ ≈ 2). Emissions from different radii, R1 (~ 1013 cm) and R2 (~ 1016–1017 cm), contribute to the transition point (E). Clearly, the X-ray luminosity originates in the SN remnant or in the newly-born BH, but not in the GRB. |
We are going to see in this Letter that Episodes 1 and 2 can differ greatly in luminosity and timescale from source to source, while we confirm that in Episode 3, the late X-ray luminosities overlap: they follow a common power-law behavior with a constant slope in the source rest frame (Pisani et al. 2013). We point out here that the starting point of this power-law component is a function of the GRB isotropic energy Eiso.
The main goals of this Letter consist in a) comparing and contrasting the steep decay, the plateau, and the power-law decay of the X-ray luminosities as functions of Eiso by considering three selected GRBs (060729, 061121, and 130427A); b) pointing out the difference in the size and the Lorentz factors of the emitting regions of Episodes 1, 2, and 3 (for definiteness we use as prototype the source with the most complete dataset, GRB 090618); c) drawing attention to the possible role of the r-process, originating in the binary system of the progenitor, to power the mildly relativistic X-ray emission in the late phases of Episode 3.
2. The case of GRB 090618
We illustrate the difference in the emitting region sizes in the three episodes and their corresponding Lorentz factors: Episode 1 has a thermal component expanding from ~ 109 cm to ~ 1010 cm on a rest-frame timescale of ~ 30 s with an average velocity of ~ 4 × 108 cm s-1 (see Izzo et al. 2012b). The total energy is 4.1 × 1052 erg, well above the traditional kinetic energy expected in the early phases of a SN, and it originates in the accretion of the material of the SN ejecta on the companion NS in the binary system (Rueda & Ruffini 2012; Ruffini et al. 2013). Episode 2 has been shown to be the ultra-relativistic prompt emission episode (e.g., the actual GRB) stemming from the collapse of the NS to a BH. Its isotropic energy is 2.5 × 1053 erg. The characteristic Lorentz factor at the transparency of the fireshell has been found to be Γ = 490 for GRB 090618. The characteristic spatial extension goes all the way up to ~ 1016–1017 cm, reached at the end of Episode 2 (see Fig. 10 in Izzo et al. 2012b). Episode 3 has an isotropic energy of ≈ 6 × 1051 erg. A striking feature occurs during its steep decay phase: in the early observed 150 s, Page et al. (2011) have found a thermal component with a decreasing temperature from ~ 0.97 keV to ~ 0.29 keV (see also Starling et al. 2012). The surface radius of the emitter can be inferred from the observed temperature To and flux FBB of the thermal component. We have, in fact (Izzo et al. 2012b), 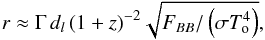 (1)where dl is the luminosity distance in the ΛCDM cosmological model and σ the Stefan-Boltzmann constant. As usual,
  , where β = v/c is the expansion velocity in units of the speed of light c.
In parallel, the relation between the detector arrival time  , the cosmological rest-frame arrival time ta and the laboratory time t, is given by
  , where θ is the displacement angle of the considered photon emission point from the line of sight (see, e.g., Bianco et al. 2001). We can then deduce the expansion velocity β, assumed to be constant, from the ratio between the variation of the emitter radius Δr and the emission duration in laboratory frame Δt, i.e. β = Δr/ (cΔt). Using the condition β ≤ cosθ ≤ 1 (Bianco et al. 2001), we obtain 0.75 ≤ β ≤ 0.89 and, correspondingly, 1.50 ≤ Γ ≤ 2.19 and radii r ~ 1013 cm (see Fig. 2).
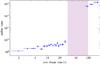 |
Fig. 2 Radii (open blue circles) of the emitting regions, measured in the cosmological rest frame. Episode 1 radius ranges from ~ 109 cm to ~ 1010 and expands at Γ ≈ 1 (Izzo et al. 2012b). The Episode 3 radius, in the early phases of the steep decay, starts from a value of ~ 7 × 1012 cm and expands at Γ ≈ 2. The Episode 2 rest-frame duration is indicated by the shaded purple region. The expansion velocity at late times is expected to approach the asymptotic value of 0.1c observed in the optical spectra (Della Valle 2011), in the absence of any further acceleration process. |
As is clear from Fig. 1, a sharp transition occurs between the end of Episode 2, where the characteristic dimensions reached by the GRB are ~ 1016–1017 cm, and the emission at the beginning of X-ray luminosity, with an initial size of ~ 7 × 1012 cm. This leads to the conclusion that the X-ray emission of Episode 3 originates in the SN ejecta or in the accretion on the newly born BH and, anyway, not from the GRB.
3. The “nested” structure of Episode 3
We now turn to show the “nested” structure of the late X-ray luminosity. Pisani et al. (2013) have shown that the X-ray rest-frame 0.3–10 keV luminosity light curves present a constant decreasing power-law behavior, at ta ≳ 104 s, with typical slopes of −1.7 ≲ αX ≲ − 1.3. This has been proven in a sample of six BdHNe: GRBs 060729, 061007, 080319B, 090618, 091127, and 111228, hereafter golden sample (GS, see, e.g., Izzo et al. 2013; Pisani et al. 2013). That the late X-ray emission could play a fundamental role as a distance indicator has been explored inferring the redshifts of GRBs 101023 and 110709B (Penacchioni et al. 2012, 2013). The IGC paradigm also allowed predicting ~ 10–15 days in the cosmological rest frame before its discovery, the occurrence of the SN associated to GRB 130427A, the most luminous source ever observed in γ rays with Eiso ≈ 1054 erg and z = 0.34 (Xu et al. 2013b; Flores et al. 2013). This was later confirmed by the observations (de Ugarte Postigo et al. 2013; Levan et al. 2013; Watson et al. 2013; Xu et al. 2013a).
We compare and contrast GRB 130427A X-ray data with GRB 060729, a member of the GS, and GRB 061121, which shows the general behavior of BdHNe. GRB 060729, at z = 0.54, has Eiso = 1.6 × 1052 erg (Grupe et al. 2007) and a SN bump in its optical afterglow (Cano et al. 2011). GRB 061121, at z = 1.314 (Bloom et al. 2006), has Eiso = 3.0 × 1053 erg, and its Episode 4 is clearly missing in view of the high cosmological redshift.
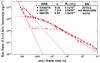 |
Fig. 3 Rest-frame 0.3–10 keV re-binned luminosity light curves of GRB 130427A (purple), GRB 061121 (red, shifted by 50 s in rest frame), and GRB 060729 (pink). The light curves are fitted by using a power-law for the steep decay phase (dashed lines) and the function in Eq. (2) for the plateau and the late decay phases (dot-dashed curves). |
In Fig. 3 we have plotted the rebinned rest-frame 0.3–10 keV luminosity light curves of GRBs 130427A, 060729, and 061121. Their steep decay is modeled by a power-law function, i.e.  , where Lp and αp are the power-law parameters. The plateau and the late power-law decay are instead modeled by using the following phenomenological function
 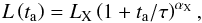 (2)where LX, αX, and τ, respectively, are the plateau luminosity, the late power-law decay index, and the characteristic timescale of the end of the plateau. From Eq. (2), we have defined the end of the plateau at the rest-frame time
 ![Mathematical equation: \hbox{$t^\ast_{\rm a}=\tau[(1/2)^{1/\alpha_{\rm X}}-1]$}](/articles/aa/full_html/2014/05/aa23812-14/aa23812-14-eq81.png) , when the luminosity of the plateau is half of the initial one,
, when the luminosity of the plateau is half of the initial one,  .
.
From this fitting procedure, we can conclude that the three BdHN systems considered here share the following properties: a) the power-law decay for the more energetic sources starts directly from the steep decay, well before the ta ≈ 2 × 10⁴ s, as indicated in Pisani et al. (2013); consequently, the plateau shrinks as a function of the increasing Eiso (see Fig. 3); b) the luminosities in the power-law decay are uniquely functions of the cosmological rest-frame arrival time ta independently on the Eiso of each source (see Fig. 3); c) most remarkably, the overlapping of the X-ray light curves reveals a “nested” structure of BdHN Episodes 3.
In our sample of BdHNe, we verify the applicability of the Dainotti-Willingale relations ⟨ Liso ⟩– and La– (Dainotti et al. 2008, 2011b; Willingale et al. 2007), where ⟨ Liso ⟩ = Eiso/ta,90 is the averaged luminosity of the prompt and ta,90 is the rest-frame t90 duration of the burst. The resulting correlations, log 10Yi = milog 10Xi + qi, are shown in Fig. 4. The parameters of each BdHN and the best fit parameters, mi and qi (where i = 1, 2), are summarized in Table 1. As is clear from the extra scatter values σi, our total BdHN sample provides tighter correlations. The extra scatter of the La–, σ = 0.26, is less than the Dainotti et al. (2011a) ones, i.e., σ = 0.76 for the whole sample of 62 bursts and σ = 0.40 for the best subsample of eight bursts (U0095). The Dainotti-Willingale correlations consider X-ray afterglows characterized by a steep decay, a plateau phase, and a late power-law decay (Nousek et al. 2006; Zhang et al. 2006), independently of their energetics. In our BdHN sample we limit the attention to a) the most energetic sources, 1052–1054 erg, b) the presence of four emission episodes (neglecting Episode 4 for z> 1), and c) sources with determined redshift and complete data at ta =104 − 106 s. All these conditions appear to be necessary to fulfill the nested structure in Fig. 3 and the tighter correlations between the astrophysical parameters ⟨ Liso ⟩, La, and in Fig. 4.
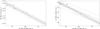 |
Fig. 4 The ⟨ Liso ⟩– |
To explain the above nested power-law decay and constrained correlations, we consider the decay of heavy elements produced in the r-process as a viable energy source (Burbidge et al. 1957), originating in binary NS mergers (see, e.g., Li & Paczyński 1998; Janka et al. 1999; Rosswog et al. 2004; Oechslin et al. 2007; Goriely et al. 2011; Piran et al. 2014).
Li & Paczyński (1998) have shown that the emission from the surface of an optically thick expanding ejecta in an adiabatic regime provides a flat light curve (see also Arnett 1982). This can explain, in principle, the observed steep decay and plateau phase of Episode 3 (see Fig. 3). After the ejecta becomes transparent, the heating source term due to the nuclear decays of the heavy nuclei, generated via r-process, becomes directly observable and dominates. The avalanche of decays with different lifetimes then provides the total energy release per unit mass per time that follows a power-law distribution, whose decay index has been estimated to be −1.4 ≲ α ≲ − 1.1 (Metzger et al. 2010). These values are strikingly similar to the ones we have found in the late X-ray luminosity.
This power-law behavior is different from the exponential decay observed in the optical light curves of traditional SN, powered by the decay of a single element (56Ni →56Co →56Fe), which is not produced in the avalanche of many decays as in the r-process.
4. Conclusions
To summarize, short GRBs have been shown to come from binary NS mergers (see, e.g., Goodman 1986; Paczynski 1986; Eichler et al. 1989; Meszaros & Rees 1997; Rosswog et al. 2003; Lee et al. 2004; and more recently Muccino et al. 2013). Our subclass of long, extremely energetic (1052–1054 erg) sources is also initially driven by a tight binary system, formed by a ν-NS and a companion NS, surrounded by the SN ejecta (see Fig. 1). Then we denoted these most energetic GRBs by “BdHNe”. This is clearly different from the gravitational collapse of a single massive progenitor star described by the collapsar model (Woosley 1993; MacFadyen & Woosley 1999; Woosley & Bloom 2006).
We compared and contrasted the late X-ray luminosities of three BdHNe with different Eiso, finding a nested structure. We showed tight correlations between ⟨ Liso ⟩, La and (see Fig. 4 and Table 1) in agreement with the Dainotti-Willingale ones.
The above scaling laws, the nesting, and the initial dimension of ~ 7 × 1012 cm and Lorentz factor of Γ ≈ 2 obtained from the steep decay of the X-ray luminosity put stringent limits on alternative theoretical models. They do not appear to be explainable within the traditional fireball jetted model, originating in the synchrotron radiation emitted by a decelerating relativistic shell with Γ ~ 102 and colliding with the circumburst medium at distances ~ 1016 cm (see, e.g., Sari et al. 1998; Piran 2005; Meszaros 2006; Gehrels et al. 2009, and reference therein). In this Letter we alternatively proposed that the late X-ray luminosity comes from the wide angle emission of the SN ejecta or in the accretion on the newly born BH. We call the attention on the role of the energy release in the SN ejecta from the decay of very heavy nuclei generated by r-process in binary NSs (Li & Paczyński 1998). This heavy nuclei avalanche decay (see, e.g., Metzger et al. 2010) may well explain the late X-ray luminosity of Episode 3. This emission follows the steep decay and plateau phase of the adiabatic optically thick expansion, prior to reaching transparency (see Fig. 3).
In the case of binary systems with longer periods and/or a lower accretion rate, which do not allow the NS companion to reach its critical mass and to form a BH, Episode 2 is missing. The presence of the companion NS will neverthless strip the H and He envelopes of the core progenitor star. These sources have low energetic bursts (Eiso< 1052 erg), such as GRB 060218 and GRB 980425, and their X-ray luminosity light curves do not overlap with the ones of our more energetic sample of BdHNe. These systems do not conform to the IGC paradigm and are traditional hypernovae1.
Acknowledgments
This work made use of data supplied by the UK Swift Science Data Center at the University of Leicester. M.E., M.K., and G.B.P. are supported by the Erasmus Mundus Joint Doctorate Program by grant Nos. 2012-1710, 2013-1471, and 2011-1640, respectively, from the EACEA of the European Commission. We warmly thank the anonymous referee for very constructive suggestions that improved the presentation of this Letter.
References
- Amati, L., Della Valle, M., Frontera, F., et al. 2007, A&A, 463, 913 [NASA ADS] [CrossRef] [EDP Sciences] [Google Scholar]
- Arnett, D. 1996, Space Sci. Rev., 78, 559 [NASA ADS] [Google Scholar]
- Arnett, W. D. 1982, ApJ, 253, 785 [NASA ADS] [CrossRef] [Google Scholar]
- Bianco, C. L., Ruffini, R., & Xue, S.-S. 2001, A&A, 368, 377 [NASA ADS] [CrossRef] [EDP Sciences] [Google Scholar]
- Bloom, J. S., Perley, D. A., & Chen, H. W. 2006, GCN Circ., 5826 [Google Scholar]
- Burbidge, E. M., Burbidge, G. R., Fowler, W. A., & Hoyle, F. 1957, Rev. Mod. Phys., 29, 547 [NASA ADS] [CrossRef] [Google Scholar]
- Cano, Z., Bersier, D., Guidorzi, C., et al. 2011, MNRAS, 413, 669 [NASA ADS] [CrossRef] [Google Scholar]
- Dainotti, M. G., Cardone, V. F., & Capozziello, S. 2008, MNRAS, 391, L79 [NASA ADS] [CrossRef] [Google Scholar]
- Dainotti, M. G., Fabrizio Cardone, V., Capozziello, S., Ostrowski, M., & Willingale, R. 2011a, ApJ, 730, 135 [NASA ADS] [CrossRef] [Google Scholar]
- Dainotti, M. G., Ostrowski, M., & Willingale, R. 2011b, MNRAS, 418, 2202 [NASA ADS] [CrossRef] [Google Scholar]
- de Ugarte Postigo, A., Xu, D., Leloudas, G., et al. 2013, GCN Circ., 14646, 1 [NASA ADS] [Google Scholar]
- Della Valle, M. 2011, International Journal of Modern Physics D, 20, 1745 [NASA ADS] [CrossRef] [Google Scholar]
- Eichler, D., Livio, M., Piran, T., & Schramm, D. N. 1989, Nature, 340, 126 [NASA ADS] [CrossRef] [Google Scholar]
- Flores, H., Covino, S., Xu, D., et al. 2013, GRB Coordinates Network, Circular Service, 14491, 1 [Google Scholar]
- Gehrels, N., Ramirez-Ruiz, E., & Fox, D. B. 2009, ARA&A, 47, 567 [NASA ADS] [CrossRef] [Google Scholar]
- Goodman, J. 1986, ApJ, 308, L47 [NASA ADS] [CrossRef] [Google Scholar]
- Goriely, S., Bauswein, A., & Janka, H.-T. 2011, ApJ, 738, L32 [Google Scholar]
- Grupe, D., Gronwall, C., Wang, X.-Y., et al. 2007, ApJ, 662, 443 [NASA ADS] [CrossRef] [Google Scholar]
- Izzo, L., Rueda, J. A., & Ruffini, R. 2012a, A&A, 548, L5 [NASA ADS] [CrossRef] [EDP Sciences] [Google Scholar]
- Izzo, L., Ruffini, R., Penacchioni, A. V., et al. 2012b, A&A, 543, A10 [NASA ADS] [CrossRef] [EDP Sciences] [Google Scholar]
- Izzo, L., Pisani, G. B., Muccino, M., et al. 2013, EAS Pub. Ser., 61, 595 [CrossRef] [Google Scholar]
- Janka, H.-T., Eberl, T., Ruffert, M., & Fryer, C. L. 1999, ApJ, 527, L39 [NASA ADS] [CrossRef] [PubMed] [Google Scholar]
- Lee, W. H., Ramirez-Ruiz, E., & Page, D. 2004, ApJ, 608, L5 [Google Scholar]
- Levan, A. J., Fruchter, A. S., Graham, J., et al. 2013, GRB Coordinates Network, Circular Service, 14686, 1 [Google Scholar]
- Li, L.-X., & Paczyński, B. 1998, ApJ, 507, L59 [Google Scholar]
- MacFadyen, A. I., & Woosley, S. E. 1999, ApJ, 524, 262 [NASA ADS] [CrossRef] [Google Scholar]
- Meszaros, P. 2006, Rep. Prog. Phys., 69, 2259 [NASA ADS] [CrossRef] [Google Scholar]
- Meszaros, P., & Rees, M. J. 1997, ApJ, 482, L29 [Google Scholar]
- Metzger, B. D., Martínez-Pinedo, G., Darbha, S., et al. 2010, MNRAS, 406, 2650 [NASA ADS] [CrossRef] [Google Scholar]
- Muccino, M., Ruffini, R., Bianco, C. L., Izzo, L., & Penacchioni, A. V. 2013, ApJ, 763, 125 [NASA ADS] [CrossRef] [Google Scholar]
- Nousek, J. A., Kouveliotou, C., Grupe, D., et al. 2006, ApJ, 642, 389 [NASA ADS] [CrossRef] [Google Scholar]
- Oechslin, R., Janka, H.-T., & Marek, A. 2007, A&A, 467, 395 [NASA ADS] [CrossRef] [EDP Sciences] [Google Scholar]
- Paczynski, B. 1986, ApJ, 308, L43 [Google Scholar]
- Page, K. L., Starling, R. L. C., Fitzpatrick, G., et al. 2011, MNRAS, 416, 2078 [NASA ADS] [CrossRef] [Google Scholar]
- Penacchioni, A. V., Ruffini, R., Izzo, L., et al. 2012, A&A, 538, A58 [NASA ADS] [CrossRef] [EDP Sciences] [Google Scholar]
- Penacchioni, A. V., Ruffini, R., Bianco, C. L., et al. 2013, A&A, 551, A133 [NASA ADS] [CrossRef] [EDP Sciences] [Google Scholar]
- Piran, T. 2005, Rev. Mod. Phys., 76, 1143 [Google Scholar]
- Piran, T., Korobkin, O., & Rosswog, S. 2014 [arXiv:1401.2166] [Google Scholar]
- Pisani, G. B., Izzo, L., Ruffini, R., et al. 2013, A&A, 552, L5 [NASA ADS] [CrossRef] [EDP Sciences] [Google Scholar]
- Rosswog, S., Ramirez-Ruiz, E., & Davies, M. B. 2003, MNRAS, 345, 1077 [NASA ADS] [CrossRef] [Google Scholar]
- Rosswog, S., Speith, R., & Wynn, G. A. 2004, MNRAS, 351, 1121 [NASA ADS] [CrossRef] [Google Scholar]
- Rueda, J. A., & Ruffini, R. 2012, ApJ, 758, L7 [NASA ADS] [CrossRef] [Google Scholar]
- Ruffini, R., Bernardini, M. G., Bianco, C. L., et al. 2008, in The Eleventh Marcel Grossmann Meeting, eds. H. Kleinert, R. T. Jantzen, & R. Ruffini (Singapore: World Scientific), 368 [Google Scholar]
- Ruffini, R., Bernardini, M. G., Bianco, C. L., et al. 2006, in The Tenth Marcel Grossmann Meeting., eds. M. Novello, S. Perez Bergliaffa, & R. Ruffini (Singapore: World Scientific), 369 [Google Scholar]
- Ruffini, R., Bernardini, M. G., Bianco, C. L., et al. 2007, ESA SP, 622, 561 [NASA ADS] [Google Scholar]
- Ruffini, R., Vereshchagin, G., & Xue, S.-S. 2010, Phys. Rep., 487, 1 [Google Scholar]
- Ruffini, R., Izzo, L., Muccino, M., et al. 2013, A&A, submitted [arXiv:1311.7432] [Google Scholar]
- Sari, R., Piran, T., & Narayan, R. 1998, ApJ, 497, L17 [NASA ADS] [CrossRef] [Google Scholar]
- Starling, R. L. C., Page, K. L., Pe’Er, A., Beardmore, A. P., & Osborne, J. P. 2012, MNRAS, 427, 2950 [NASA ADS] [CrossRef] [Google Scholar]
- Watson, A. M., Butler, N., Kutyrev, A., et al. 2013, GCN Circ., 14666, 1 [NASA ADS] [Google Scholar]
- Willingale, R., O’Brien, P. T., Osborne, J. P., et al. 2007, ApJ, 662, 1093 [NASA ADS] [CrossRef] [Google Scholar]
- Woosley, S. E. 1993, ApJ, 405, 273 [NASA ADS] [CrossRef] [Google Scholar]
- Woosley, S. E., & Bloom, J. S. 2006, ARA&A, 44, 507 [NASA ADS] [CrossRef] [Google Scholar]
- Xu, D., de Ugarte Postigo, A., Kruehler, T., et al. 2013a, GCN Circ., 14597, 1 [NASA ADS] [Google Scholar]
- Xu, D., de Ugarte Postigo, A., Schulze, S., et al. 2013b, GCN Circ., 14478, 1 [NASA ADS] [Google Scholar]
- Zhang, B., Fan, Y. Z., Dyks, J., et al. 2006, ApJ, 642, 354 [NASA ADS] [CrossRef] [Google Scholar]
All Tables
All Figures
|
Fig. 1 IGC space–time diagram (not in scale) illustrates the relativistic motion of Episode 2 (Γ ≈ 500, thick line) and the non-relativistic Episode 1 (Γ ≈ 1) and Episode 3 (Γ ≈ 2). Emissions from different radii, R1 (~ 1013 cm) and R2 (~ 1016–1017 cm), contribute to the transition point (E). Clearly, the X-ray luminosity originates in the SN remnant or in the newly-born BH, but not in the GRB. |
| In the text | |
|
Fig. 2 Radii (open blue circles) of the emitting regions, measured in the cosmological rest frame. Episode 1 radius ranges from ~ 109 cm to ~ 1010 and expands at Γ ≈ 1 (Izzo et al. 2012b). The Episode 3 radius, in the early phases of the steep decay, starts from a value of ~ 7 × 1012 cm and expands at Γ ≈ 2. The Episode 2 rest-frame duration is indicated by the shaded purple region. The expansion velocity at late times is expected to approach the asymptotic value of 0.1c observed in the optical spectra (Della Valle 2011), in the absence of any further acceleration process. |
| In the text | |
|
Fig. 3 Rest-frame 0.3–10 keV re-binned luminosity light curves of GRB 130427A (purple), GRB 061121 (red, shifted by 50 s in rest frame), and GRB 060729 (pink). The light curves are fitted by using a power-law for the steep decay phase (dashed lines) and the function in Eq. (2) for the plateau and the late decay phases (dot-dashed curves). |
| In the text | |
|
Fig. 4 The ⟨ Liso ⟩– |
| In the text | |
Current usage metrics show cumulative count of Article Views (full-text article views including HTML views, PDF and ePub downloads, according to the available data) and Abstracts Views on Vision4Press platform.
Data correspond to usage on the plateform after 2015. The current usage metrics is available 48-96 hours after online publication and is updated daily on week days.
Initial download of the metrics may take a while.