| Issue |
A&A
Volume 565, May 2014
|
|
|---|---|---|
| Article Number | A91 | |
| Number of page(s) | 6 | |
| Section | Extragalactic astronomy | |
| DOI | https://doi.org/10.1051/0004-6361/201423719 | |
| Published online | 16 May 2014 | |
Gas reservoir of a hyper-luminous quasar at z = 2.6⋆
1
IRAM – Institut de RadioAstronomie Millimétrique,
300 rue de la Piscine,
38406
Saint Martin d’Hères
France
e-mail:
This email address is being protected from spambots. You need JavaScript enabled to view it.
2
INAF – Osservatorio astronomico di Roma,
via Frascati 33
00040
Monteporzio Catone,
Italy
3
University of Bologna, Department of Physics and
Astronomy, viale Berti Pichat
6/2, 40127
Bologna,
Italy
4
Max Planck Institut für Extraterrestrische Physik,
Giessenbachstrasse 1,
85748
Garching bei München,
Germany
5
INAF – Osservatorio Astronomico di Bologna,
via Ranzani 1
40127
Bologna,
Italy
6
Laboratoire AIM, CEA/DSM-CNRS-Université Paris Diderot,
Irfu/Service d’Astrophysique, CEA Saclay,
Orme des Merisiers France,
91191
Gif-sur-Yvette Cedex,
France
7
Departamento de Ciencias Fisicas, Universidad Andres
Bello, Av. Republica
252, Santiago,
Chile
8
Cavendish Laboratory, University of Cambridge 19 J. J. Thomson
Avenue, Cambridge
CB3 0HE,
UK
9
Kavli Institute for Cosmology, University of
Cambridge, Madingley
Road, Cambridge
CB3 0HA,
UK
10
Astronomy Centre, Dept. of Physics and Astronomy, University of
Sussex, Falmer,
Brighton
BN1 9QH,
UK
Received: 27 February 2014
Accepted: 18 March 2014
Abstract
Context. Understanding the relationship between the formation and evolution of galaxies and their central super-massive black holes (SMBH) is one of the main topics in extragalactic astrophysics. Links and feedback may reciprocally affect both black hole and galaxy growth.
Aims. Observations of the CO line at the main epoch of galaxy and SMBH assembly (z = 2−4) are crucial to investigating the gas mass, star formation, and accretion onto SMBHs, and the effect of AGN feedback. Potential correlations between AGN and host galaxy properties can be highlighted by observing extreme objects.
Methods. We targeted CO(3–2) in ULAS J1539+0557, a hyper-luminous quasar (Lbol > 1048 erg/s) at z = 2.658, selected through its unusual red colour in the UKIDSS Large Area Survey (ULAS).
Results. We find a molecular gas mass of 4.1 ± 0.8 × 10¹⁰ M⊙, by adopting a conversion factor α = 0.8 M⊙ K-1 km s-1 pc2, and a gas fraction of ~0.4−0.1, depending mostly on the assumed source inclination. We also find a robust lower limit to the star-formation rate (SFR = 250−1600 M⊙/yr) and star-formation efficiency (SFE = 25−350 L⊙/(K km s-1 pc2) by comparing the observed optical-near-infrared spectral energy distribution with AGN and galaxy templates. The black hole gas consumption timescale, M(H2) /Ṁacc, is ~160 Myr, similar to or higher than the gas consumption timescale.
Conclusions. The gas content and the star formation efficiency are similar to those of other high-luminosity, highly obscured quasars, and at the lower end of the star-formation efficiency of unobscured quasars, in line with predictions from AGN-galaxy co-evolutionary scenarios. Further measurements of the (sub)mm continuum in this and similar sources are mandatory to obtain a robust observational picture of the AGN evolutionary sequence.
Key words: galaxies: evolution / galaxies: active / quasars: general / quasars: emission lines
Based on observations carried out with the IRAM Plateau de Bure Interferometer. IRAM is supported by INSU/CNRS (France), MPG (Germany), and IGN (Spain).
© ESO, 2014
1. Introduction
Understanding the relations between the formation and evolution of galaxies and their central super massive black holes (SMBH) is a major challenge of present-day astronomy. Most galaxy assembly and accretion activity occurs at z = 2−4, so it is crucial to study SMBH-galaxy relationships at this epoch. The two main open questions are a) what is the mechanism triggering nuclear accretion and star-formation? and b) are active galactic nucleus (AGN) outflows truly able to regulate star-formation in their host galaxies? Observations of molecular gas are useful to addressing both questions. So far, molecular gas has been detected in a few tens of z > 2 quasars, with typical masses 1−10 × 1010 M⊙, indicating gas-rich hosts. However, most of these observations have been done either on lensed objects (where the intrinsic luminosity is magnified by factors of up to ~100), or on z = 5−6 quasars (Riechers 2011, and references therein).
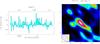 |
Fig. 1 Left panel: spectrum of ULAS J1537+0557 integrated over the beam. The solid line shows the Gaussian fit with |
There is a growing evidence for two modes of star-formation which may also be relevant for triggering nuclear activity: a quiescent one, taking place in most star-forming galaxies, with gas conversion time scales of ~1 Gyr, and a less common star-burst mode, acting on much shorter time scales (~107−108 yr; Rodighiero et al. 2011; Lamastra et al. 2013a and references therein). The star-burst mode is likely related to the powering of high luminosity quasars. In fact, bolometric luminosities of the order of 1047−1048 erg/s imply mass accretion rates of tens to hundreds of M⊙/yr onto 109−1010 M⊙ SMBHs (assuming a radiative efficiency of 0.1). If the accretion lasts for a few tens of Myr (Salpeter timescale), this in turn implies gas reservoirs of 109−1010 M⊙ funneled towards the central ~kpc region. Galaxy interactions seem to be the best (if not the only) mechanism capable of destabilizing large fractions (ΔMgas ~ Mgas) of the gas reservoirs towards the central ~kpc region on short time scales (Cavaliere & Vittorini 2000; Tacconi et al. 2006). This naturally produces powerful AGNs hosted in star-burst galaxies (Lamastra et al. 2013b). In principle, from the gas consumption timescale (or its inverse, the so-called star formation efficiency (SFE) i.e. the ratio between the star-formation rate and the gas mass), one can directly derive information on the AGN and star-formation triggering mechanisms.
The SFE also depends on the SMBH gas consumption time scales and on the energy injected in the interstellar medium by the AGN (feedback). High SFE may be the outcome of a small cold gas reservoir that was reduced by on-going SMBH accretion and consequent AGN feedback. For this reason, to have information on AGN feedback is crucial for addressing both questions. There is both theoretical and observational evidence that high-luminosity quasars drive powerful outflows. Theoretically, physically motivated models predict strong winds from AGNs with SMBH larger than 108 M⊙ (Zubovas & King 2014, and references therein). These models in general predict mass flows proportional to the AGN bolometric luminosity to some power ( in the Menci et al. 2008 model). For these reasons, the most luminous quasars in the Universe are ideal and unique targets with which study AGN/galaxy feedback mechanisms regulated by powerful outflows. Powerful and massive AGN-driven outflows of molecular gas were recently discovered in luminous quasars (Maiolino et al. 2012; Feruglio et al. 2010; Cicone et al. 2013). Broad absorption lines (BALs) with outflow velocities up to several thousand km s-1 are common in high-luminosity quasars (Borguet et al. 2013); BALs are found in 40% of mid-infrared selected quasars (Dai et al. 2008) and in 40% of the WISE selected luminous quasars (Bongiorno et al., in prep.). Powerful, galaxy-wide outflows have also been found in ionised gas using the broad [OIII] emission line (Cano-Diaz et al. 2012).
In this paper we present results from the first Plateau de Bure Interferometer (PdBI) observation of a hyper-luminous quasar, selected from the UKIDSS Large Area Survey (ULAS) and the VISTA (J, K bands) Hemisphere Survey: ULAS J1539+0557 at z = 2.658 (RA:15:39:10.2, Dec: 05:57:50.0, Banerji et al. 2012). The source ULAS J1539+0557 is heavily reddened (rest frame AV ~ 4) and has a bright 22 μm flux of 19 mJy in the WISE All-Sky Survey, corresponding to λLλ(7.8 μm) = 1047 erg/s, and a bolometric luminosity of Lbol ~ 1048 erg/s. The black hole mass is as large as 7.4 × 10⁹ M⊙. As detailed in Banerji et al. (2012), these hyper-luminous quasars are unlikely to be lensed, and therefore they truly trace an extremely luminous population.
Hyper-luminous quasars at z > 2.
In the following we present the results of 3 mm observations of ULAS J1539+0557, targeting the CO(3–2) transition. We derive the gas mass, dynamical mass, and star-formation rate (SFR) of the host galaxy through the comparison of the observed UV-mid-infrared spectral energy distribution (SED) with galaxy templates. We compare the observed gas masses, gas fraction and gas consumption timescale with those of the other quasars and galaxies at similar redshift. We finally discuss future desirable developments in this topic. A H0 = 70 km s-1 Mpc-1, ΩM = 0.3, ΩΛ = 0.7 cosmology is adopted throughout.
2. Millimetre observations and results
The quasar ULAS J1539+0557 was observed at a frequency of 94.5 GHz with the PdBI array in the most compact (D) configuration in September 2013. The system temperature was between 80 and 120 K, and water vapor about 5 mm. The quasar 1546+027 (1.8 Jy at 94.5 GHz) was used as a phase and amplitude calibrator. The quasar 3C 454.3 (10.1 Jy) was used for bandpass and absolute flux calibration. We estimate a 10% error on the absolute flux calibration. Calibration and mapping were done in the GILDAS environment. The flagging of the phase visibilities was fixed at 35% rms in order to maximise the signal-to-noise ratio (S/N) of the detection. This flagging yields a 1σ sensitivity of 0.21 mJy/beam in 20 MHz channels, and a total 6-antenna equivalent on-source time of 3.2 h With natural weighting, the synthesised beam is 8.9 by 5.0 arcsec.
Figure 1 shows the spectrum and collapsed map of ULAS J1537+0557. The best S/N for the line detection is achieved in the velocity range −944 to 1518 km s-1 (FWZI = 2460 km s-1). There, the zero spacing flux of the line is 0.56 ± 0.1 mJy, at a position of 0.5, 0.3 arcsec offset from the phase centre, based on the fit of the visibilities with an unresolved source model, and adopting the statistical error. The CO(3−2) emission line lies at the frequency corresponding to the optical spectroscopic redshift. The integrated flux of CO(3–2) is 1.37 ± 0.25 Jy km s-1 over the full line width (FWZI). The luminosity of the CO line, L′CO, can be estimated by extrapolating to the CO(1–0) luminosity from the CO(3–2) flux, using excitation models of high-z quasars (Riechers et al. 2006; Riechers 2011). The observed scatter (see e.g. Carilli & Walter 2013) is of the same order of magnitude as the relative error on the CO flux of ULAS J1539+0557, and therefore we neglect it in the following estimates. We then find a line luminosity L′CO = (5.1 ± 0.9) × 1010 K km s-1 pc2. By assuming a line luminosity ratio r32 = 1 and a conversion factor XCO = 0.8 M⊙ K-1 km s-1 pc2 (Carilli & Walter 2013), we derive a total molecular gas mass of M(H2) = (4.1 ± 0.8) × 1010 M⊙. The 3 mm continuum is not detected (3σ upper limit of 0.1 mJy).
The CO(3–2) line profile in Fig. 1 is broad. Fitting the profile over the full velocity range with a single Gaussian component we find that the FWHM is 1600 ± 700 km s-1. This would be among the highest FWHM measured for quasars (Wang et al. 2010; Carilli & Walter 2013). Although noisy, the line profile in Fig. 1 appears asymmetric, skewed toward positive velocities. The feature at positive velocities might either be a different component of the emission or noise. If we exclude from the fit velocities >500 km s-1 the best-fit line width is narrower,  km s-1. Fitting the profile with two Gaussian functions we obtain a best fit solution with a main component centred at zero velocity with FWHM = 1100 ± 450 km s-1 and a second, fainter component centred at about 1200 km s-1. This would suggest that the complex line profile is the result of a merging system (see e.g. Fu et al. 2013). The S/N of the data is not good enough to disentangle the different possibilities. In the following we conservatively assume that the FWHM of the line is
  km s-1. The source appears unresolved, but the limits on its extension are quite loose (physical size < 40 kpc) because of the large synthesised beam.
The CO line width can be converted into a dynamical mass assuming a size R and an inclination i of a rotating molecular gas disk. We derive the product of the circular velocity at the outer CO radius vc times the sine of inclination, v × sin(i), by dividing the FWHM of the CO line by 2.4 (Tacconi et al. 2006). The dynamical mass can then be estimated as  , assuming R = 2 kpc, a value commonly used for quasars (see e.g. Coppin et al. 2008), similar to that measured for the molecular disk of lower luminosity quasars (Krips et al. 2007), local quasars (Mrk 231, Downes & Solomon 1998), and for SMGs (Tacconi et al. 2006, 2008).
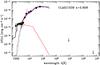 |
Fig. 2 Optical to radio wavelength rest-frame SED of ULAS J1539+0557 fitted with two components: a highly extincted AGN model (E(B − V) = 1.1, magenta line), and a galaxy component (with different extinction, E(B − V) = 0.2, red line). The solid black line shows the sum of the two components. The arrows indicate the 3σ upper limits in the continuum at 3 mm (these observations) and at 20 cm from the FIRST survey. |
Table 1 compares CO line FWHM, gas, and dynamical mass of ULAS J1539+0557 to those of the only other three available z > 2, hyper-luminous (λLλ(7.8 μm) ≳ 1047 erg/s) quasars. The large FWHM of CO(3–2) of ULAS J1539+0557 suggests a non-negligible inclination. If i = 20 deg, as in SBSJ1408+567 (Coppin et al. 2008), Mdyn ~ 5 × 10¹¹ M⊙; if i = 45 deg, Mdyn ~ 1011 M⊙. The ratio between the gas mass and the dynamical mass MH2/Mdyn is therefore likely to be in the range 0.4–0.1. The assumption of a disk geometry in CO-based estimates of high-z quasar host galaxies may lead to a bias if these are actually undergoing major mergers (Aravena et al. 2011).
3. Spectral energy distribution
The quasar ULAS J1539+0557 has never been observed at far-infrared or (sub)millimetre wavelengths. It is possible, however, to compile a robust broad-band SED from the UV to the 22 μm band (photometry from Banerji et al. 2013). The source is undetected in the FIRST VLA survey (Becker et al. 2012) and the 3σ upper limit is 0.375 mJy at 20 cm. The SED in the quasar rest frame is shown in Fig. 2. The SED at rest-frame wavelengths above ~4000 Å is clearly dominated by the AGN. The emission of the AGN rapidly drops below 3000 Å, indicating that the nuclear emission is substantially obscured, consistent with the colour selection of this source in the UKIDSS survey (Banerji et al. 2013). The SED below 3000 Å is probably dominated by starlight from the host galaxy. Translating the observed 1500 Å luminosity into a SFR, assuming the Madau (1998) conversion and zero galaxy extinction, provides a firm lower limit to the host galaxy SFR of 70 M⊙/yr. The real SFR is probably much higher than this value, if the galaxy is substantially obscured by dust, but difficult to constrain because of the lack of far-infrared data.
To obtain a better SFR estimate, we modelled the broad-band, 0.1–6 μm SED by using a library of AGN and galaxy templates (Bongiorno et al. 2012). For the AGN component, we used the mean quasar SED from Richards et al. (2006), while for the galaxy component, a library of synthetic spectra generated using the stellar population synthesis models of Bruzual & Charlot (2003) has been adopted. Both the AGN and the galaxy templates can be affected by dust extinction. For a given galaxy template, the free parameters in the fit are thus normalisation and extinction of both AGN and galaxy templates. We accepted solutions with galaxy stellar masses smaller than 1012 M⊙ and SFR× duration of the starburst ≲ total stellar mass. The best-fit values are 400 M⊙/yr of SFR and 3 × 10¹⁰ M⊙ for the stellar mass. The 1σ confidence intervals for SFR and stellar mass are 250–1600 M⊙/yr and 3 × 10¹⁰−3 × 10¹¹ M⊙, respectively. The best-fit extinction for the AGN and the galaxy is E(B − V) = 1.1 and 0.2, respectively.
4. Discussion
The quasar ULAS J1539+0557 is an extreme object, with a bolometric luminosity of Lbol = 1.6 × 1048 erg/s (derived from the 5100 Å continuum), and a SMBH mass, estimated from the Hα emission line, as large as 7.4 × 10⁹ M⊙ (Banerji et al. 2012). This implies that the SMBH is accreting at the Eddington limit, at a rate of dm/ dt = 200−300 M⊙/yr. At this rate, the black hole gas consumption timescale, M(H2) /Ṁacc, would be only ~160 Myr.
In the following we discuss the source properties in comparison with other known luminous systems. A clean estimator for the intrinsic AGN power is its mid-infrared luminosity, since it guarantees little bias against dusty objects and little extinction (or absorption) corrections. Recently, the WISE satellite has performed the deepest all-sky survey at 22 μm, which samples the rest frame 4–8 μm band at z = 2−4 (where AGN heated warm dust is the main component to the total flux), finding the most luminous AGN in the sky at z < 4−5. It is therefore convenient to use the 7.8 μm luminosity (λLλ(7.8 μm)) as a reliable proxy for the AGN power. By measuring λLλ(7.8 μm) of all quasars with CO detections, we find that only three of these sources at z < 5 have extreme intrinsic luminosities (λLλ(7.8 μm) ≳ 1047 erg/s). Other six quasars with CO detection have 1046<λLλ(7.8 μm) < 1046.5 erg/s, including the two highly obscured SWIRE quasars of Polletta et al. (2011). To characterise quantitatively the unique population of hyper-luminous quasars we need to substantially increase the sample with gas mass, dynamical mass, and SFR detections.
Figure 3 plots L′CO against λLλ(7.8 μm) for a compilation of both unobscured and highly obscured AGN. The luminosities of lensed objects have been corrected for the published lens amplification factor. A rough correlation between the AGN luminosity and the CO luminosity is present. We note that the scatter in the correlation is higher for the lensed objects, probably because both luminosities have been corrected for the same amplification factor, but the source of the 7.8 μm luminosity is most likely very compact (pc scale), while the source of the CO luminosity could be more extended (a few kpc), implying an amplification pattern more complex than the assumed one. The 7.8 μm luminosities of highly obscured (Compton thick, NH > 1024 cm-2, two are from Polletta et al. 2011, and Mrk 231) have been computed using the 6.5–22 μm fluxes, not corrected for extinction, which however may be relevant in highly obscured objects even at such long wavelengths. AGNs at z > 5.8 are found at the lower part of the correlation. Non-lensed quasars at z = 1.5−5 with λLλ(7.8 μm) > a few 1046 erg/s have high L′CO, in the range 3−8 × 10¹⁰ K km s-1 pc2.
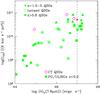 |
Fig. 3 L′CO versus λLλ(7.8 μm) for a compilation of AGN. The red triangle corresponds to ULAS J1539+0557. |
To convert L′CO into gas mass we again adopt a conversion factor XCO = 0.8, as in most studies of AGN, ULIRGs, and SMGs (see Carilli & Walter 2013). The molecular gas mass of ULAS J1539+0557 and three other hyper-luminous quasars (Table 1) are in the range 3−6 × 10¹⁰ M⊙. We evaluate the dynamical mass of ULAS J1539+0557 under admittedly major assumptions (the FWHM estimated from the core of the CO(3−2) line, the size of the molecular gas disk of 2 kpc and its inclination angle). We find that the gas mass is 0.1–0.4 of the dynamical mass. This suggests that the host galaxy of this hyper-luminous quasar is not deprived of gas, and it is likely forming stars actively, in agreement with the prediction of semi-analytic models for AGN/galaxy co-evolution (Lamastra et al. 2013b).
The SFE is usually computed as SFE = LFIR/L′CO. Since ULAS J1539+0557 has never been observed at far-infrared (FIR) or submm wavelengths, we do not have a direct measure of LFIR. We can, however, estimate LFIR from the SFR obtained from the SED fitting, using the conversion SFR = 2−1.2 × 10⁻¹⁰(LFIR/L⊙) M⊙/yr (Scoville 2012). We find SFE in the range 25–350 L⊙/(K km s-1 pc2), which correspond to gas consumption timescales from 25 Myr to 160 Myr, smaller than or equal to the black hole gas consumption timescale computed above (assuming that AGN feedback has not yet been able to significantly modify its environment and reduce the total host galaxy cold gas mass).
For a SFR in the range 250–1600, the ratio Ṁacc/SFR is in the range 0.1−1, which is ~2−3 orders of magnitude above the mean value 10-3 found by Mullaney et al. (2012) for AGN with star-forming hosts in GOODS-S, thus suggesting that ULAS J1539+0557 is an outlier to the AGN main sequence. The SMBH mass is ≳ 2% of the dynamical mass, so MBH/M∗ is of the order of 0.1 or higher, i.e. 2 orders of magnitude larger than the canonical value. This means that, although ULAS J1539+0557 has an extremely massive SMBH, this SMBH seems to live in an ordinary galaxy host with Mdyn ~ 1011 M⊙, which is uncommon at this redshift, but not at higher redshift. Stochastic fluctuations between SMBH and SF activity, as advocated by Mullaney et al. (2012), are unlikely to give rise to such extreme outliers.
In Fig. 4 we plot the SFE against redshift, for ULAS J1539 and a compilation of AGN and galaxies (samples of Daddi et al. 2007; Genzel et al. 2000; Riechers et al. 2011, and references therein; Krips et al. 2012). The uncertainty on SFE is due to both the uncertainty on the evaluation of the SFR from SED fitting, and that associated to the conversion from SFR to LFIR. Its SFE is consistent with both the locus of normal, star-forming galaxies and that of SMGs, ULIRGs and luminous quasars. At face value, the SFE of ULAS J1539+0557 is lower than (although still statistically consistent with) that of other luminous quasars at similar or lower redshift (Riechers et al. 2011). It is similar to that of other highly obscured, but less extreme AGN. For example, Krips et al. (2012) found SFE in the range 100−200 in nearby Type 2 quasars, and Polletta et al. (2011) found similar SFE in two galaxies hosting high-luminosity, obscured quasars at z ~ 3. Therefore, ULAS J1539+0557 may be an extreme case of a dust enshrouded, hyper-luminous quasar.
In the AGN/galaxy coevolution scenario obscured AGN may be an early phase of the life cycle of luminous quasars (Sanders et al. 1988; Menci et al. 2008, and references therein), in which the strong AGN outflows have not yet cleared the host galaxy from most of its gas and dust, thus resulting in a lower SFE than that of unobscured quasars. Conversely, luminous unobscured quasars may be caught at the end of this process, and have high SFE because the AGN feedback has been already efficient in expelling a large fraction of the gas. The uncertainties on the SFR and SFE of ULAS J1539+0557 are, however, too large to allow a firm conclusion.
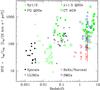 |
Fig. 4 SFE versus redshift for a compilation of AGN and star-forming galaxies (from Daddi et al. 2007; Genzel et al. 2010; Riechers et al. 2011, and references therein; Krips et al. 2012). The red triangle corresponds to ULAS J1539+0557. |
5. Conclusions
We detected CO(3–2) in the hyper-luminous quasar ULAS J1539+0557 at z = 2.658, a source selected for its extremely red colours in the UKIDSS Large Area Survey (ULAS) and brightness at 22 μm in the WISE Survey. We find a molecular gas reservoir of 4.1 ± 0.8 × 10¹⁰ M⊙. The dynamical mass is not well constrained, but it could be 2–10 times higher, depending mostly on the gas disk size and inclination. In any case, the host galaxy does not appear deprived of cold gas, suggesting that it is still actively forming stars. From fitting of the UV to mid-infrared SED, we derived a robust lower limit to the SFR and gas consumption time scale. The ratio of SMBH accretion to star-formation rate, Ṁacc/SFR, is significantly higher than that found by Mullaney et al. (2012) for AGN with star-forming hosts. The SFE is similar to that of highly obscured, high-luminosity quasars. This class of quasars is believed to witness the brief evolutionary phase that traces the transition from a heavily enshrouded ULIRG-like phase of black-hole growth to the blue unobscured quasars. Thanks to their high luminosity these exceptional objects are ideal laboratories for investigating the physics of the feedback phenomenon with in situ observations at the peak of galaxy and SMBH assembly. The high luminosity allows the highlighting of the correlation between SFE and other parameters (obscuration, AGN luminosity).
The WISE All-Sky Survey, the UKIDSS survey, and the VISTA Hemisphere Survey have revealed a population of hyper-luminous quasars in the near- and mid-infrared. These selections have already produced reasonably large hyper-luminous quasar samples at z ~ 1.5−4, the main epoch of galaxy formation and accretion activity in the Universe. Recently, Banerji et al. (2014) presented IR and X-ray observations of a similar source from the same parent sample, ULAS J1234+0907 at redshift 2.5, finding high SFR (≳2000 M⊙/yr) and high X-ray luminosity (≳1045 erg/s), thus confirming that infrared selection is efficient at discovering a population of hyper-luminous quasars in the blowout phase.
It is crucial that we increase the sample of hyper-luminous quasars with good estimates of both gas mass, dynamical mass, LFIR, and X-ray luminosity, including both unobscured and highly obscured quasars. These goals can be achieved with the present and future generation of millimetre interferometers, such as the PdBI, NOEMA, and ALMA.
Acknowledgments
F.F., A.B. and C.F. acknowledge support from PRIN-INAF 2011. M.B. acknowledges support from the FP7 Career Integration Grant “eEASy” (CIG 321913). I.G. acknowledges support from FONDECYT through grant 11110501.
References
- Aravena, M., Wagg, J., Papadopoulos, P. P., et al. 2011, ApJ, 737, 64 [NASA ADS] [CrossRef] [Google Scholar]
- Banerji, M., McMahon, R.G., Hewett, P. C., et al. 2012, MNRAS, 427, 2275 [NASA ADS] [CrossRef] [Google Scholar]
- Banerji, M., McMahon, R. G., Hewett, P. C., Gonzalez-Solares, E., & Koposov, S. E. 2013, MNRAS, 429, L55 [NASA ADS] [CrossRef] [Google Scholar]
- Banerji, M., Fabian, A. C., & McMahon, R. G. 2014, MNRAS, 439, L51 [NASA ADS] [CrossRef] [Google Scholar]
- Becker, R. H., Helfand, D. J., White, R. L., Gregg, M. D., & Laurent-Muehlheisen, S. A. 2012, VizieR On-line Data Catalog: VIII/90 [Google Scholar]
- Bongiorno, A., Merloni, A., Brusa, M., et al. 2012, MNRAS, 527, 3103 [NASA ADS] [CrossRef] [Google Scholar]
- Borguet, B. C. J., Arav, N., Edmonds, D., et al., 2013, ApJ, 762, 49 [NASA ADS] [CrossRef] [Google Scholar]
- Cavaliere, A., & Vittorini, V. 2000, ApJ, 543, 599 [NASA ADS] [CrossRef] [Google Scholar]
- Carilli, C. L., & Walter, F. 2013, ARA&A, 51, 105 [NASA ADS] [CrossRef] [EDP Sciences] [Google Scholar]
- Carniani, S., Marconi, A., Biggs, A., et al. 2013, A&A, 559, A29 [NASA ADS] [CrossRef] [EDP Sciences] [Google Scholar]
- Cicone, C., Feruglio, C., Maiolino, R., et al. 2012, A&A, 543, A99 [NASA ADS] [CrossRef] [EDP Sciences] [Google Scholar]
- Daddi, E., Elbaz, D., Walter, F., et al. 2010, ApJ, 714, 118 [Google Scholar]
- Dai, X., Shankar, F., & Sivakoff, G. R. 2008, ApJ, 672, 108 [NASA ADS] [CrossRef] [Google Scholar]
- Downes, D., & Solomon, P. M. 1998, ApJ, 507, 615 [NASA ADS] [CrossRef] [Google Scholar]
- Faucher-Giguère, C.-A., & Quataert, E. 2012, MNRAS, 425, 605 [NASA ADS] [CrossRef] [Google Scholar]
- Feruglio, C., Maiolino, R., Piconcelli, E., et al. 2010, A&A, 518, A155 [Google Scholar]
- Genzel, R., Baker, A. J., Tacconi, L., et al. 2003, ApJ, 584, 633 [NASA ADS] [CrossRef] [Google Scholar]
- Genzel, R., Tacconi, L., Gracia-Carpio, J., et al. 2010, MNRAS, 407, 209 [Google Scholar]
- King, A. R. 2010, MNRAS, 402, 1516 [NASA ADS] [CrossRef] [Google Scholar]
- Krips, M., Neri, R., Garcia-Burillo, S., et al. 2008, ApJ, 677, 262 [NASA ADS] [CrossRef] [Google Scholar]
- Krips, M., Neri, R., & Cox, P. 2012, ApJ, 753, 135 [NASA ADS] [CrossRef] [Google Scholar]
- Lamastra, A., Menci, N., Fiore, F., & Santini, P. 2013a, A&A, 552, A44 [NASA ADS] [CrossRef] [EDP Sciences] [Google Scholar]
- Lamastra, A., Menci, N., Fiore, F., et al. 2013b, A&A, 559, A56 [NASA ADS] [CrossRef] [EDP Sciences] [Google Scholar]
- Madau, P., Pozzetti, L., Dickinson, M., et al. 1998, ApJ, 498, 106 [NASA ADS] [CrossRef] [Google Scholar]
- Maiolino, R., Gallerani, S., Neri, R., et al. 2012, MNRAS, 425, 66 [Google Scholar]
- Menci, N., Fiore, F., Puccetti, S., & Cavaliere, A. 2008, ApJ, 686, 219 [NASA ADS] [CrossRef] [Google Scholar]
- Polletta, M., Nesvadba, N. P. H., Neri, R., et al., 2011, A&A, 533, A20 [NASA ADS] [CrossRef] [EDP Sciences] [Google Scholar]
- Richards, G. T., Lacy, M., Storrie-Lombardi, L. J., et al. 2006, ApJS, 166, 470 [NASA ADS] [CrossRef] [Google Scholar]
- Riechers, D. A. 2011, ApJ, 730, 108 [NASA ADS] [CrossRef] [Google Scholar]
- Riechers, D. A., Walter, F., Carilli, C. L., et al. 2006, ApJ, 650, 604 [NASA ADS] [CrossRef] [Google Scholar]
- Riechers, D. A., Carilli, C. L., Maddalena, R. J., et al. 2011, ApJ, 739, 32 [Google Scholar]
- Rodighiero, G., Daddi, E., Baronchelli, I., et al. 2011, ApJ, 739, L40 [NASA ADS] [CrossRef] [Google Scholar]
- Sanders, D. B., Soifer, B. T., Elias, J. H., et al. 1988, ApJ, 325, 74 [NASA ADS] [CrossRef] [Google Scholar]
- Solomon, P. M., Downes, D., Radford, S. J. E., et al. 1997, ApJ, 478, 144 [NASA ADS] [CrossRef] [Google Scholar]
- Tacconi, L., Neri, R., Chapman, S. C., et al. 2006, ApJ, 640, 228 [NASA ADS] [CrossRef] [Google Scholar]
- Tacconi, L., Genzel, R., Smail, I., et al. 2008, ApJ, 680, 246 [NASA ADS] [CrossRef] [PubMed] [Google Scholar]
- Wang, R., Carilli, C. L., Neri, R., Riechers, D., & Wagg, J. 2010, ApJ, 714, 699 [NASA ADS] [CrossRef] [Google Scholar]
- Zhang, K., Dong, X., Wang, T., & Gaskell, C. M. 2011, ApJ, 737, 71 [NASA ADS] [CrossRef] [Google Scholar]
- Zubovas, K., & King, A. 2012, ApJ, 745, 34 [Google Scholar]
- Zubovas, K., & King, A. 2014, MNRAS, 439, 400 [NASA ADS] [CrossRef] [Google Scholar]
All Tables
All Figures
|
Fig. 1 Left panel: spectrum of ULAS J1537+0557 integrated over the beam. The solid line shows the Gaussian fit with |
| In the text | |
|
Fig. 2 Optical to radio wavelength rest-frame SED of ULAS J1539+0557 fitted with two components: a highly extincted AGN model (E(B − V) = 1.1, magenta line), and a galaxy component (with different extinction, E(B − V) = 0.2, red line). The solid black line shows the sum of the two components. The arrows indicate the 3σ upper limits in the continuum at 3 mm (these observations) and at 20 cm from the FIRST survey. |
| In the text | |
|
Fig. 3 L′CO versus λLλ(7.8 μm) for a compilation of AGN. The red triangle corresponds to ULAS J1539+0557. |
| In the text | |
|
Fig. 4 SFE versus redshift for a compilation of AGN and star-forming galaxies (from Daddi et al. 2007; Genzel et al. 2010; Riechers et al. 2011, and references therein; Krips et al. 2012). The red triangle corresponds to ULAS J1539+0557. |
| In the text | |
Current usage metrics show cumulative count of Article Views (full-text article views including HTML views, PDF and ePub downloads, according to the available data) and Abstracts Views on Vision4Press platform.
Data correspond to usage on the plateform after 2015. The current usage metrics is available 48-96 hours after online publication and is updated daily on week days.
Initial download of the metrics may take a while.