| Issue |
A&A
Volume 565, May 2014
|
|
|---|---|---|
| Article Number | A50 | |
| Number of page(s) | 8 | |
| Section | Extragalactic astronomy | |
| DOI | https://doi.org/10.1051/0004-6361/201423547 | |
| Published online | 05 May 2014 | |
A Spitzer-IRS view of early-type galaxies with cuspy/core nuclei and fast/slow rotation
1 INAF Osservatorio Astronomico di Padova, Vicolo dell’Osservatorio 5, 35122 Padova, Italy
e-mail: This email address is being protected from spambots. You need JavaScript enabled to view it.
2 Instituto Nacional de Astrofísica, Optica y Electrónica, , Apdos. Postales 51 y 216, CP 72000 Puebla, Pue., Mexico
3 Scuola Internazionale Superiore di Studi Avanzati (SISSA), via Bonomea, 265, 34136 Trieste, Italy
4 GEPI, Observatoire de Paris, CNRS, Univ. Paris Diderot, Place Jules Janssen, 92190 Meudon, France
Received: 31 January 2014
Accepted: 15 March 2014
Abstract
Context. The recent literature suggests that an evolutionary dichotomy exists for early-type galaxies (Es and S0s, ETGs) whereby their central photometric structure (cuspy vs. core central luminosity profiles), and figure of rotation (fast vs. slow rotators), are determined by whether they were formed by “wet” or “dry” mergers.
Aims. We consider whether the mid-infrared (MIR) properties of ETGs, with their sensitivity to accretion processes in particular in the last few Gyr (on average z ≲ 0.2), can put further constraints on this picture.
Methods. We investigate a sample of 49 ETGs for which nuclear MIR properties and detailed photometrical and kinematical classifications are available from the recent literature.
Results. In the stellar light cuspy/core ETGs show a dichotomy that is mainly driven by their luminosity. However, in the MIR, the brightest core ETGs show evidence that accretions have triggered both AGN and star formation activity in the recent past, challenging a dry merger scenario. In contrast, we do find in the Virgo and Fornax clusters that cuspy ETGs, fainter than MKs = −24, are predominantly passively evolving in the same epoch, while in low-density environments they tend to be more active. A significant and statistically similar fraction of both fast rotators (FRs) (38-11+18 %) and slow rotators (SRs) (50-21+34%) shows polycyclic aromatic hydrocarbon features in their MIR spectra. Ionized and molecular gas are also frequently detected. Recent star formation episodes are then a common phenomenon in both kinematical classes, even in those dominated by AGN activity, suggesting a similar evolutionary path in the last few Gyrs.
Conclusions. MIR spectra suggest that the photometric segregation between cuspy and core nuclei and the dynamical segregation between FRs and SRs must have originated before z ~ 0.2.
Key words: galaxies: elliptical and lenticular, cD / infrared: galaxies / galaxies: fundamental parameters / galaxies: evolution
© ESO, 2014
1. Introduction
A relatively large fraction of early-type galaxies (ETGs) at high redshift show clear evidence of interaction and/or merger morphologies and active star formation (e.g. Treu et al. 2005) supporting the model view that these galaxies are produced by a halo merger process (see e.g. Mihos 2004; Cox et al. 2008; Khochfar et al. 2011; De Lucia et al. 2011, and reference therein). A further element for high redshift formation scenarios comes from their measured [α/Fe] ratios, encoding information about the timescales of star formation. In massive ETGs this ratio has super-solar values, suggesting that they formed on relatively short timescales (see e.g. Chiosi et al. 1998; Granato et al. 2004; Thomas et al. 2005; Annibali et al. 2007; Clemens et al. 2009). Annibali et al. (2007) estimated that a fair upper limit to the recent rejuvenation episodes is ~25% of the total galaxy mass, but that they are typically much less intense than that (see e.g. the Spitzer-IRS study of NGC 4435 by Panuzzo et al. 2007). However, rejuvenation signatures in ETGs are often detected, not only in the galaxy nucleus, but also in the disk, rings, and even in galaxy outskirts, as clearly shown by GALEX (e.g. Rampazzo et al. 2007; Marino et al. 2009, 2011; Salim & Rich 2010; Thilker et al. 2010), so that the different phases of galaxy assembly/evolution, and their link to morphological and kinematical signatures, are vivaciously debated.
The merger process may involve either relatively few major or multiple minor events during the galaxy assembly. Furthermore, it may or may not include dissipation (and star formation), two possibilities often called wet and dry mergers, respectively (see e.g. van Dokkum 2005). Other mechanisms, however, like conversion of late-type galaxies into ETGs by environmental effects, like strangulation, ram-pressure, etc. (e.g. Boselli & Gavazzi 2006), and by energy feedback from supernovae may also be important (e.g. Kormendy et al. 2009).
Two observable quantities are thought to distinguish ETGs produced by wet and dry mergers. The first, mainly the fruit of high-resolution observations with the Hubble Space Telescope and of high precision photometric analyses, is the presence of either a cusp or a core in the inner galaxy luminosity profile (Lauer et al. 1991, 1992; Côté et al. 2006; Turner et al. 2012). In contrast to cuspy profiles, the surface brightness in core profiles becomes shallower as r → 0. The same concept is considered by Kormendy et al. (2009) who divide ETGs into cuspy-core and core-less, depending on whether the luminosity profile misses light or has an extra-light component with respect to the extrapolation of Sersic’s law at small radii. Kormendy et al. (2009) suggest that cuspy-core nuclei have been scoured by binary black holes (BHs) during the last dissipationless, dry major merger. In contrast, core-less nuclei originate from wet mergers. Analogously, Côté et al. (2006) and Turner et al. (2012) found an extra stellar nucleus in the profile decomposition of ETGs in their Virgo (ACSVCS) and Fornax (ACSFCS) surveys in addition to simple Sersic profiles, in particular in low-luminosity(/mass) ETGs. They proposed that the most important mechanism for the assembly of a stellar nucleus is the infall of star clusters through dynamical friction, while for more luminous(/massive) galaxies a wet scenario (gas accretion by mergers/accretions and tidal torques) dominates.
The second observable quantity is the kinematical class. The class is defined by a parameter describing the specific baryonic angular momentum defined as  , where r is the galacto-centric distance, and V and σ are luminosity weighted averages of the rotation velocity and velocity dispersion over a two-dimensional (2D) kinematical field. The measurement refers to the inner part of the galaxy, typically of the order of or less than 1 effective radius, re, i.e. significantly larger than the regions where cusps and cores are detected. The value λr divides ETGs into the two classes of fast rotators (FR) and slow rotators (SR) (Emsellem et al. 2011, and reference therein). The FRs are by far the majority of ETGs (86±2% in the ATLAS3D survey) and SRs represent massive ETGs that might have suffered from significant merging without being able to rebuild a fast rotating component. Khochfar et al. (2011) find that the underlying physical reason for the different growth histories is the slowing down, and ultimately complete shut-down, of gas cooling in massive, SR galaxies. On average, the last gas-rich major merger interaction in SR happens at z> 1.5, followed by a series of minor mergers which build up the outer layers of the remnant, i.e. do not feed the inner part of the galaxy.
Fast rotators in the models of Khochfar et al. (2011) have different formation paths. Most of them (78%) have bulge-to-total stellar mass ratios (B/T) larger than 0.5 and manage to grow stellar discs due to continued gas cooling as a result of frequent minor mergers. The remaining 22% live in high-density environments and consist of low B/T galaxies with gas fractions below 15% that have exhausted their cold gas reservoir and have no hot halo from which gas can cool. Summarizing, a dissipative merging and/or a gas accretion episode from interacting companions, could be the way for the galaxy to rebuild a fast-rotating disk-like component. Basically, SR and FR correspond to the paradigms of dry vs. wet accretions/mergers respectively.
Recently, Lauer (2012) attempted to unite the structural and kinematical views, claiming that they are two aspects of the same process. Using the specific angular momentum λre/ 2, computed from the 2D kinematics within half the effective radius by Emsellem et al. (2011), Lauer (2012) showed that core galaxies have rotation amplitudes λre/ 2 ≤ 0.25 while all galaxies with λre/ 2> 0.25 and ellipticity ϵre/ 2> 0.2 lack cores. Some FRs have a core profile, but they argue that both figure of rotation and the central structure of ETGs should be used together to separate systems that appear to have formed from wet and dry mergers. Krajnović et al. (2013b) show, however, that there is a genuine population of FRs with cores. They suggest that the cores of both FRs and SRs are made of old stars and are found in galaxies typically lacking molecular and atomic gas, with few exceptions.
For the sake of simplicity throughout the paper, we will call core ETGs those galaxies for which the luminosity profile shallows out as r → 0 (i.e. cuspy-core in Kormendy et al. 2009; core in Lauer 2012; non-nucleated in Côté et al. 2006 and in Turner et al. 2012). We will refer to cuspy ETGs as those which present an extra central luminosity component (i.e. core-less in Kormendy et al. 2009; power-law + intermediate in Lauer 2012; nucleated in Côté et al. 2006 and in Turner et al. 2012) with respect to a fit of a Sersic model. Depending on the accurate surface brightness profile decomposition performed by the above authors, the cuspy vs. core classification given by different authors for the same ETG is rarely discrepant.
This note aims to contribute to the debate on the origin of core/cuspy and FR/SR ETGs, and the connection to the wet vs. dry merger hypotheses, using mid-infrared (MIR) spectra of well-studied ETGs. The paper is organized as follows. In Sect. 2 we briefly describe how Spitzer-IRS spectra trace the recent few Gyr evolution in ETGs. We present the MIR vs. the cuspy/core nuclear properties of ETGs (Kormendy et al. 2009; Côté et al. 2006; Turner et al. 2012; Lauer 2012) in Sect. 3, and vs. the FR/SR kinematical classes (Emsellem et al. 2011) in Sect. 4. Conclusions are presented in Sect. 5.
The Virgo sample in Kormendy et al. (2009) with Spitzer-IRS MIR class.
2. A classification of Spitzer-IRS spectra of ETGs
Using Spitzer-IRS, Rampazzo et al. (2013) have recently produced an atlas of low-resolution MIR spectra of 91 nearby (D ≤ 72 Mpc) ETGs in the Revised Shapley-Ames Catalog (RSA). Spectra are extracted within a common aperture (3.6′′ × 18′′) providing an integral view of the galaxy’s inner region. On average, the area covered by the rectangular IRS aperture is about 2−3 times the area of a circle of radius re/ 8. Mid-infrared spectra then cover a region where the cuspy/core profiles and/or the departures from the Sersic profile are measured, as well as a significant part of the region where FRs vs. SRs are separated, using λre/ 2, for example. In addition, dry vs. wet mergers maximize their possible signatures in the galaxy nucleus, as shown by the study of line-strength indices (e.g. Annibali et al. 2007, and references therein), by counter-rotating components (e.g. Emsellem et al. 2011) and morphological peculiarities such as irregular/chaotic dust-lanes (e.g. Côté et al. 2006; Turner et al. 2012).
For each galaxy, the atlas provides the fully reduced and calibrated spectrum, the intensity of nebular and molecular emission lines and polycyclic aromatic hydrocarbons (PAHs), after a template spectrum of a passively evolving ETG has been subtracted. Spectra are classified into five mid-infrared classes, ranging from AGN (class -4) and star forming nuclei (class 3), transition class 2 (with PAHs) and class 1 (no-PAHs) to passively evolving nuclei (class 0) (Bressan et al. 2006). Panuzzo et al. (2011) suggest that each of the five MIR classes is a snapshot of the evolution of ETG nuclei during an accretion episode, starting from, and ending with, a class 0 spectrum (see their Fig. 11). Vega et al. (2010) suggest that anomalous PAHs in class 2 spectra are produced by carbon stars which are present in stellar populations with ages in the range of a few Gyr (Nanni et al. 2013, see their Table 1), depending on the metallicity, corresponding, on average, to a redshift coverage z ≲ 0.2.
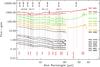 |
Fig. 1 ETGs in the sample of Kormendy et al. (2009). MIR classes are colour coded (black = class 0; yellow = class 1; green = class 2; and red = class 4. Nebular lines in the spectra are indicated with vertical red solid lines. PAH complexes are indicated with dotted areas. H2 rotational emission lines are indicated with black solid lines. |
Mid-infrared spectral classes show a dichotomy between the Es and S0s, i.e. the classical morphological classification provided by RSA. Rampazzo et al. (2013) found that 46 % of Es and 20
 % of S0s have a spectrum of class 0, i.e. Es are significantly more passive than S0s. A small, similar (~9
 %) fraction of Es and S0s have PAH ratios typical of star forming galaxies. The PAHs are detected in 47
 % of ETGs and with a statistically similar fraction in Es and S0s. Basically, half of ETGs (41%) in the sample show kinematical and/or morphological scars of recent accretion episodes.
In this note we investigate ETGs subdivided into the new, well-defined photometric (cuspy vs. core) and kinematical (FR/SR) classes. To this end, we cross-correlate the MIR RSA sample described above with the Kormendy et al. (2009), Lauer (2012), Côté et al. (2006), Turner et al. (2012), and ATLAS3D samples (see e.g. Emsellem et al. 2011, and references therein) to investigate the recent nuclear star formation history. Fourteen ETGs in Virgo, in particular the brighter ones, are in common with Kormendy et al. (2009) who classified them as either cuspy-core or core-less (i.e. core and cuspy in the present paper); 26 are in common with the ACSVCS+ACSFCS surveys in which galaxies are separated into core+Sersic and Sersic type nuclei (Côté et al. 2006; Turner et al. 2012); and 41 out of 91 ETGs in the RSA MIR atlas are in common with the ATLAS3D survey sample. For these galaxies Emsellem et al. (2011) provide a classification of FR or SR. The inner luminosity profiles of these ETGs have been classified into cuspy (power-law and intermediate) or core by Lauer (2012) (23 out of 41) and by Krajnović et al. (2013b) for a total of 44 objects.
3. MIR spectra vs. nuclear features in ETGs
3.1. The Virgo sample of Kormendy et al. (2009)
The structural and photometric properties of a sample of Es (some galaxies are classified S0 in the Revised Shapley Ames Catalogue Sandage & Tammann 1987 as shown in Table 1) in the Virgo cluster have been well studied by Kormendy et al. (2009). The authors divided their sample according to departures at small radii from the Sersic, log I ∝ r1 /n, law. Ten Es with total absolute magnitudes MVT ≤ − 21.66, i.e. the brightest objects of their sample, have core luminosity profiles. This class of ETGs miss light with respect to the extrapolation of Sersic’s law at small radii. Seventeen fainter galaxies, mostly Es in RSA, in the magnitude range −21.54 ≤ MVT ≤ − 15.53, are cuspy, having excess light in their centre with respect to the inward extrapolation of the outer Sersic profile.
With the exception of NGC 4406, all core ETGs in the Kormendy et al. (2009) sample, listed in the top part of Table 1, have a MIR spectrum in the RSA sample of Rampazzo et al. (2013). The IRS spectra are also available for three cuspy ETGs, namely NGC 4621, NGC 4473 and NGC 4478; NGC 4570, NGC 4660, and NGC 4564, having absolute magnitudes similar to that of NGC 4478, also have IRS spectra, but values for the extra light component have not been quantified by Kormendy et al. (2009). We have collected the basic data in Table 1.
According to Kormendy et al. (2009), core and cuspy ETGs have fundamentally different properties. Core ETGs are slowly rotating, have anisotropic velocity distributions, boxy isophotes, Sersic index n> 4, and are α-element enhanced, i.e. their stellar populations formed on short timescales. In contrast, cuspy ETGs rotate rapidly, are more isotropic and have disky isophotes. They tend to have lower values of the Sersic index, n ≃ 3 ± 1, and be less α-enhanced. All cuspy ETGs are fast rotators, while most (7 out of 9) of core Es are slow rotators within re/ 2 (Emsellem et al. 2011) (Table 1, Col. 7).
The sample of ATLAS3D ETGs with a Spitzer-IRS class.
The MIR spectra of the subset of Kormendy et al. (2009) ETGs is shown in Fig. 1. All cuspy galaxies have a passive, class 0 spectrum characterized by the 10 μm silicon feature produced by oxygen rich AGB stars. Their kinematics show signatures of past interaction/accretion episodes, such as kinematically decoupled cores (KDC) and multiple velocity components (MC). All have low nuclear X-ray luminosities (38.18 ≤ log LX,nucl ≤ 38.92 erg s-1, Pellegrini 2010) indicating that no AGN are active, as also supported by the low radio power at 1.4 GHz (most are upper limits while NGC 4563 has P1.4 GHz = 4.9 × 10¹⁹ W Hz-1, Brown et al. 2011) (see also Rampazzo et al. 2013, Table B.1).
A more active picture emerges for core ETGs. The MIR spectra indicate nuclei with different kinds of activity from AGN (class 4, M 87, and NGC 4261) to post-star forming (MIR class 2 with anomalous PAHs, NGC 4374, NGC 4636, NGC 4552) to the quiescent nucleus of NGC 4365 (class 0).
Most SRs and FRs show signatures of kinematical and morphological peculiarities suggesting the action of accretion episodes. Of particular interest is NGC 4382; although it shows strong shell features (see e.g. Fig. 9 in Kormendy et al. 2009) it has a nearly passively evolving nucleus (class 1). This is not the case for NGC 4374 and NGC 4552, which both show fine structure (see Sansom, Hibbard & Schweizer 2000), although less prominent than that in NGC 4382. The class 2 spectrum of NGC 4552 reveals the presence of gas and the additional presence of anomalous PAHs, as in NGC 4374, points to the occurrence of a recent star formation event.
Summarizing, there is evidence that accretions in the brightest, core Es in the Kormendy et al. (2009) sample have triggered both AGN and SF activity, a challenge for completely dry mergers/accretions in the last few Gyrs. In contrast, the few cuspy galaxies in the present MIR sample are all passively evolving. They may have either been quiescent for a very long time (the radio power may take longer to vary; see e.g. Brown et al. 2011) or possible accretions have been “sterile”, i.e. activating neither AGN nor star formation. An additional hint of a different recent evolution of the two photometric classes may come from the observation that dust appears to be totally absent in cuspy ETGs, while most of the core ETGs do show dust (Col. 9 in Table 1). Clemens et al. (2010) found that dust can survive no longer than a few tens of Myr in the hostile ETG environment, so if present, should be quite recently acquired.
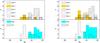 |
Fig. 2 Ks-band absolute magnitude, MK, distribution vs. MIR classes (top panels) and cuspy/core ETGs in the Virgo plus Fornax clusters (Côté et al. 2006; Turner et al. 2012) (left panel) and in the total sample, including ETGs in low-density environments in Krajnović et al. (2013b). |
3.2. The ACS Virgo and Fornax ETGs samples
The passive evolution of all six of the fainter cuspy ETGs in our subset of the Kormendy et al. (2009) sample prompted us to enlarge the sample to fainter galaxies. A large HST study of the inner regions of ETGs in the Virgo and Fornax clusters has been performed by Côté et al. (2006) and Turner et al. (2012), the ACSVCS and ACSFCS, respectively. The final sample with MIR spectra includes 23 ETGs in Virgo (top part of Table 2) and 8 ETGs in Fornax (bottom of Table 2) that have been classified by Turner et al. (2012) with an ACS class of either core (originally non-nucleated) or cuspy (originally nucleated). Additional ETGs in low-density environments, with a MIR spectrum in Rampazzo et al. (2013) and a Sersic decomposition of the luminosity profile, come from Krajnović et al. (2013b) and are listed in Table 2.
In Fig. 2 we plot the absolute Ks-band magnitude distribution of cuspy and core ETGs in the Virgo and Fornax clusters (bottom-left panel) and of the entire sample (bottom-right panel). Côté et al. (2006) and Turner et al. (2012) noticed that virtually none of the bright ETGs are cuspy, in contrast to the fainter ones, as shown by the lower panel in Fig. 2. The percentage of cuspy ETGs in Virgo and Fornax reaches 67%±8% and 72%±13%, respectively, among fainter galaxies in their sample. In the top-left panel of Fig. 2 we show the distribution of MIR classes in the same bins of MK magnitude. Most of the cuspy ETGs have MIR class 0 spectra, indicating passive evolution in their nucleus. Considering ETGs with MK ≥ − 24, 82 %1 of the galaxies are cuspy, of which 59
 % are passively evolving and only 18
 % show PAH features. The brightest (MK ≤ − 25) ETGs have cores, and various MIR spectra are found, from class 0 to class 4, as noticed before in the Kormendy et al. (2009) sample. However, active MIR classes, 1–4, are distributed along all the MK range examined, suggesting that wet accretions occur at the entire magnitude/mass bins.
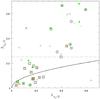 |
Fig. 3 Specific baryonic angular momentum, λre/ 2, vs. average ellipticity, ϵre/ 2, measured for the 41 ETGs in Table 2 (see references in the table caption.) The solid line separates FRs from SRs according to Emsellem et al. (2011). The dashed line separates ETGs with cuspy profiles (large circles) from core galaxies (large squares) in the sample of Lauer (2012). MIR classes are coded as follows: square = class 0; cross = class 1; full dot = class 2; star = class 3, and diamonds = class 4. |
In the right panels of Fig. 2 we consider the entire sample of 44 ETGs with a MIR spectrum and a core/cuspy classification. Of the whole sample, 62 % of the passive ETGs are cuspy. For the subset fainter than MK = −24, 87
 % are cuspy, 57
 % are passively evolving, and 33
 % show PAHs in their MIR spectra. Although the increase in the number of galaxies is modest going from cluster to low-density environments, the number of active galaxies (classes 1, 2, 3 and 4) tends to increase at all magnitude/mass bins, suggesting a possible environmental effect (see e.g. Clemens et al. 2006, 2009). Serra et al. (2012) detected HI in 40% of ETGs outside Virgo and 10% inside it.
4. MIR spectra vs. fast and slow rotators
With the aim of investigating the MIR properties of FRs vs. SRs in the re/ 2 region, we cross-correlate the samples adding a measure of the specific angular momentum to our sample with a MIR nuclear classification. In the Rampazzo et al. (2013, Table 5) sample of MIR spectra, 41 out of 91 ETGs have a measure of the specific angular momentum. Table 2 provides the list of ETGs with a FR/SR classification within re/ 2 (Col. 8 from Emsellem et al. 2011, ATLAS3D: Table B1) and their MIR class (Col. 10). The list includes 29 FRs and 12 SRs. The Fornax ETGs lack the kinematical classification in the re/ 2 region.
In Fig. 3 the specific angular momentum at re/ 2, λre/ 2, is plotted against the corresponding average ellipticity, ϵre/ 2 (Table 2, Cols. 5 and 6). According to Lauer (2012) the dashed line in the figure separates the core and cuspy ETGs into different rotation classes, leaving the core set contaminated only by face-on cuspy galaxies. The figure shows the 23 galaxies of Lauer (2012), among the 41 ETGs in Emsellem et al. (2011) (large squares for SRs, large circles for FRs). Figure 3 plainly shows that different MIR classes are found associated with both FRs and SRs, as well as in core and cuspy ETGs.
The fraction of SRs and FRs with a class 0 spectrum, i.e. that are passively evolving, is 25 % and 52
 %, respectively. This means that the fraction of SRs and FRs showing emission lines (MIR classes 1, 2, 3, and 4), i.e. the complement of passive ETGs, 75
 % and 48
 %, respectively. In the whole Rampazzo et al. (2013) sample, 64
 % of the nuclei show emission lines, although with different intensity. These results are in agreement with optical studies in which, depending on the sample, the ionized gas is detected in ≈50−90% of ETGs (Phillips et al. 1986; Macchetto et al. 1996; Sarzi et al. 2006, 2010; Yan et al. 2006; Serra et al. 2008; Annibali et al. 2010). This suggests that wet-mergers/accretions have played a role in the last few Gyrs of both SRs and FRs.
The fraction of SRs and FRs showing PAH features (MIR classes 2, 3, and 4) is 50 % and 38
 %, respectively, indicating that in about half of both SRs and FRs a star formation episode has recently occurred (Kaneda et al. 2008; Panuzzo et al. 2011; Rampazzo et al. 2013). Galaxies with normal PAH ratios, class 3 spectra, are in the minority: only 10
 % of FRs show star forming spectra and 8
 % SRs. All MIR class 4 spectra, 17
 % of SRs and 3
 % of FRs, show PAHs. The optical study of 65 ETGs of Annibali et al. (2010) provided indications that the AGN phenomenon is associated with star formation.
5. Summary and conclusions
This note investigates whether the photometric segregation between cuspy and core nuclei and/or the dynamical segregation between fast and slow rotators can be attributed to formation via wet or dry mergers.
We explore the question by comparing the MIR spectral characteristics with their cuspy/core morphology (Kormendy et al. 2009; Lauer 2012; Côté et al. 2006; Turner et al. 2012; Krajnović et al. 2013a) and FR/SR characterization (ATLAS3D). We use the Spitzer-IRS spectra and MIR classes discussed in Panuzzo et al. (2011) and Rampazzo et al. (2013). These spectra are sensitive to the last few Gyrs (z ≲ 0.2) of the ETGs evolution. We find the following:
-
With the exception of NGC 4365, which is passively evolving, MIR spectra of all the bright core ETGs in the Kormendy et al. (2009) sample show nebular emission lines, and PAH features are detected in 5 out of 9 objects. These types of nuclei should have recently accreted gas-rich material. If these objects formed via dry mergers, the process was completed before z ~ 0.2 and wet accretions have happened since; AGN feedback does not prevent a late star formation episode in the bright Es NGC 4374, NGC 4636, and NGC 4552. The few (6) faint, cuspy ETGs in the Kormendy et al. (2009) sample all show passively evolving spectra, irrespective of their magnitude.
-
The MIR spectra of the total cuspy/core sample (44 ETGs), confirm that ETGs fainter than MKs = −24 mag, mostly cuspy, are predominantly passively evolving. This fact is particularly significant in Virgo and Fornax where 82
 % are cuspy, the majority also FRs. Kormendy et al. (2009) noticed that cuspy ETGs have disky (positive a4/a Fourier coefficient) isophotes in the nuclear region, a structure that suggests some form of dissipation during the formation. The passive MIR spectra suggest that either this infall was sterile, i.e. without star formation, or happened at z ≳ 0.2, so as to leave no trace in the present MIR spectra. The Khochfar et al. (2011) models suggest that a fraction of FRs lying in high-density environments have a residual gas fraction below 15%, i.e. they have exhausted their cold gas reservoir and have no hot halo from which gas can cool. Counterparts in low-density environments (Fig. 2, right panel) show the tendency to be more gas rich and hence more active.
 -
A significant fraction of both FRs (38
 %) and SRs (50
 %) shows PAH features in their MIR spectra. Ionized and molecular gas are also commonly detected. Recent star formation episodes are not a rare phenomenon in either FRs or SRs, even in those dominated by AGN activity (see also, Annibali et al. 2010). Recently, observing HI rich ETGs, Serra et al. (2014) found that SRs are detected as often, host as much H I and have a similar rate of H I discs/rings as FRs.
Despite the expectation that the signature of wet or dry merger is strongest in the galaxy nucleus, the nuclear MIR spectra do not clearly link the core versus cuspy morphology and the FR versus SR kinematical class to these alternative formation scenarios. Within the last few Gyrs, only at the two extremes of the ETG luminosity, does the dichotomy emerge: the brightest core, mostly SRs and faint cuspy, mostly FRs (in the Virgo and Fornax clusters) separate into mostly active and passive ETGs, respectively. The result, however, is in contrast to what is expected for core-SR versus cuspy-FR, i.e. a dry vs. wet accretion scenario.
The obvious possibility is that these photometric and kinematical classes are signatures generated by the two different evolutionary scenarios at z ≳ 0.2 (see e.g. Khochfar et al. 2011), so that they do not affect the MIR spectra. On the other hand, adopting the traditional E/S0s morphological subdivision Rampazzo et al. (2013) found that Es are significantly more passive than S0s in the same epoch. Fast/Slow rotator classes may smooth away differences between Es and S0s, since a large fraction of Es transit into the FR class. At the same time, recent observations tend to emphasize the complexity of ETGs when their study is extended to large radii (see also Serra et al. 2014). Arnold et al. (2014) recently obtained the extended, up to 2−4 re, kinematics of 22 ETGs in RSA. They find that only SRs remain slowly rotating in their halos, while the specific angular momentum of ETGs classified as FRs within re = 1, may dramatically change at larger radii. Arnold et al. (2014) suggest that the traditional E/S0 classification better accounts for the observed kinematics up to large radii and likely of their complex evolutionary scenario.
The fractions reported consider upper and lower errors corresponding to 1σ Gaussian errors (Gehrels 1986).
Acknowledgments
R.R. acknowledges partial financial support by contracts ASI-INAF I/016/07/0 and ASI-INAF I/009/10/0. O.V. acknowledges support from the Conacyt grant CB-2012-183013. This research has made use of the NASA/IPAC Infrared Science Archive, which is operated by the Jet Propulsion Laboratory, California Institute of Technology, under contract with the National Aeronautics and Space Administration.
References
- Annibali, F., Bressan, A., Rampazzo, R., Zeilinger, & Danese, L. 2007, A&A, 463, 455 [NASA ADS] [CrossRef] [EDP Sciences] [Google Scholar]
- Annibali, F., Bressan, A., Rampazzo, R., et al. 2010, A&A, 519, A40 [NASA ADS] [CrossRef] [EDP Sciences] [Google Scholar]
- Arnold, J. A., Romanowsky, A. J., Brodie, J. P., et al. 2014, ApJ, submitted [arXiv:1310.2607] [Google Scholar]
- Boselli, A., & Gavazzi, G. 2006, PASP, 118, 517 [NASA ADS] [CrossRef] [Google Scholar]
- Bressan, A., Panuzzo, P., Buson, L., et al. 2006, ApJ, 639, L55 [NASA ADS] [CrossRef] [Google Scholar]
- Brown, M. J. I., Januzzi, B. T., Floyd, D. J. E., & Mould, J. R. 2011, ApJ, 731, L41 [NASA ADS] [CrossRef] [Google Scholar]
- Chiosi, C., Bressan, A., Portinari, L., & Tantalo, R. 1998, A&A, 339, 355 [NASA ADS] [Google Scholar]
- Clemens, M. S., Bressan, A., Nikolic, B., et al. 2006, MNRAS, 370, 702 [NASA ADS] [CrossRef] [Google Scholar]
- Clemens, M. S., Bressan, A., Nikolic, B., & Rampazzo, R. 2009, MNRAS, 392, L35 [NASA ADS] [CrossRef] [Google Scholar]
- Clemens, M. S., Jones, A. P., Bressan, A., Baes, Bendo, M. G. J., et al. 2010, A&A, 518, L50 [NASA ADS] [CrossRef] [EDP Sciences] [Google Scholar]
- Corsini, E. M., & Bertola, F. 1998, J. Korean Phys. Soc., 33, 574 [Google Scholar]
- Côté, P., Slawomir, P., Ferrarerse, L., et al. 2006, ApJS, 165, 57 [NASA ADS] [CrossRef] [MathSciNet] [Google Scholar]
- Cox, T. J., Jonsson, P., Somerville, R. S., Primack, J. R., & Dekel, A. 2008, MNRAS, 384, 386 [NASA ADS] [CrossRef] [Google Scholar]
- De Lucia, G., Fontanot, F., Wilman, D., & Monaco, P. 2011, MNRAS, 414, 1439 [NASA ADS] [CrossRef] [Google Scholar]
- Emsellem, E., Cappellari, M., Peletier, R. F., McDermid, R. M., & Bacon, R. 2004, MNRAS, 352, 721 [NASA ADS] [CrossRef] [Google Scholar]
- Emsellem, E., Cappellari, M., Krajnović, D., et al. 2011, MNRAS, 414, 888 [NASA ADS] [CrossRef] [Google Scholar]
- Gehrels, N. 1986, ApJ, 303, 336 [NASA ADS] [CrossRef] [Google Scholar]
- Granato, G. L., De Zotti, G., Silva, L., Bressan, A., & Danese, L. 2004, ApJ, 600, 580 [Google Scholar]
- Kaneda, H., Honaka, T., Sakon, L., et al. 2008, ApJ, 684, 270 [NASA ADS] [CrossRef] [MathSciNet] [Google Scholar]
- Khochfar, S., Emsellem, E., Serra, P., et al. 2011, MNRAS, 417, 845 [NASA ADS] [CrossRef] [Google Scholar]
- Kormendy, J., Fisher, D. B., Cornell, M. E., & Bender, R. 2009, ApJS, 182, 216 [NASA ADS] [CrossRef] [Google Scholar]
- Krajnović, D., Bacon, R., Cappellari, M., et al. 2008, MNRAS, 390, 93 [NASA ADS] [CrossRef] [Google Scholar]
- Krajnović, D., Alatalo, K., Blitz, L., et al. 2013a, MNRAS, 432, 1768 [NASA ADS] [CrossRef] [Google Scholar]
- Krajnović, D., Karick, A. M., Davies, R. L., et al. 2013b, MNRAS, 433, 2812 [NASA ADS] [CrossRef] [Google Scholar]
- Lauer, T. R. 2012, ApJ, 759, 64 [NASA ADS] [CrossRef] [Google Scholar]
- Lauer, T. R., Faber, S. M., Holtzman, J. A., et al. 1991, ApJ, 369, L41 [NASA ADS] [CrossRef] [Google Scholar]
- Lauer, T. R., Faber, S. M., Currie, D. G., et al. 1992, AJ, 104, 552 [NASA ADS] [CrossRef] [Google Scholar]
- Macchetto, F., Pastoriza, M., Caon, N., et al. 1996, A&A, 120, 463 [Google Scholar]
- Malin, D. F., & Carter, D. 1983, ApJ, 274, 534 [NASA ADS] [CrossRef] [Google Scholar]
- Marino, A., Iodice, E., Tantalo, R., et al. 2009, A&A, 508, 235 [Google Scholar]
- Marino, A., Rampazzo, R., Bianchi, L., et al. 2011, MNRAS, 411, 311 [NASA ADS] [CrossRef] [Google Scholar]
- Mihos, J. C. 2004, in Clusters of Galaxies: Probes of Cosmological Structure and Galaxy Evolution (Cambridge, New York: Cambridge University Press), 277 [Google Scholar]
- Nanni, A., Bressan, A., Marigo, P., & Girardi, L. 2013, MNRAS, 434, 2390 [NASA ADS] [CrossRef] [Google Scholar]
- Phillips, M. M., Jenkins, C. R., Dopita, M. A., Sadler, E. M., & Binette, L. 1986, AJ, 91, 1062 [NASA ADS] [CrossRef] [Google Scholar]
- Panuzzo, P., Vega, O., Bressan, A., et al. 2007, ApJ, 656, 206 [NASA ADS] [CrossRef] [Google Scholar]
- Panuzzo, P., Rampazzo, R., Bressan, A., et al. 2011, A&A, 528, A10 [NASA ADS] [CrossRef] [EDP Sciences] [Google Scholar]
- Pellegrini, S. 2010, ApJ, 717, 640 [NASA ADS] [CrossRef] [Google Scholar]
- Pinkney, J., Gebhardt, K., Bender, R., et al. 2003, ApJ, 596, 903 [NASA ADS] [CrossRef] [Google Scholar]
- Rampazzo, R., Marino, A., Tantalo, R., et al. 2007, MNRAS, 381, 245 [NASA ADS] [CrossRef] [Google Scholar]
- Rampazzo, R., Panuzzo, P., Vega, O., Bressan, A., & Clemens, M. 2013, MNRAS, 432, 374 [NASA ADS] [CrossRef] [Google Scholar]
- Salim, S., & Rich, R. M. 2010, ApJ, 714, L290 [NASA ADS] [CrossRef] [Google Scholar]
- Sandage, A., & Tammann, G. A. 1987, Carnegie Institution of Washington Publication, 2nd edn. (Washington: Carnegie Institution) [Google Scholar]
- Sansom, A. E., Hibbard, J. E., & Schweizer, F. 2000, AJ, 120, 1946 [Google Scholar]
- Sarzi, M., Falcón-Barroso, J., Davies, R. L., et al. 2006, MNRAS, 366, 1151 [NASA ADS] [CrossRef] [Google Scholar]
- Sarzi, M., Shields, J. C., Schawinski, K., et al. 2010, MNRAS, 402, 2187 [NASA ADS] [CrossRef] [Google Scholar]
- Serra, P., Trager, S. C., Oosterloo, T. A., & Morganti, R. 2008, A&A, 483, 57 [NASA ADS] [CrossRef] [EDP Sciences] [Google Scholar]
- Serra, P., Oosterloo, T. A., Morganti, R., et al. 2012, MNRAS, 422, 1835 [NASA ADS] [CrossRef] [Google Scholar]
- Serra, P., Oser, L., Krajnović, D., et al. 2014, MNRAS, 2014, submitted [arXiv:1401.3180] [Google Scholar]
- Tal, T., van Dokkum, P. G., Nelan, J., & Bezanson, R. 2009, AJ, 138 1417 [Google Scholar]
- Thilker, D. A., Bianchi, L., Schiminovich, D., et al. 2010, ApJ, 714, L171 [NASA ADS] [CrossRef] [Google Scholar]
- Thomas, D., Maraston, C., & Bender, R. 2005, ApJ, 621, 673 [NASA ADS] [CrossRef] [Google Scholar]
- Treu, T., Ellis, R. S., Liao, T. X., et al. 2005, ApJ, 633, 174 [NASA ADS] [CrossRef] [Google Scholar]
- Turner, M., Côté, P., Ferrarese, L. L., et al. 2012, ApJS, 203, 5 [NASA ADS] [CrossRef] [Google Scholar]
- van Dokkum, P. G. 2005, AJ, 130, 2647 [NASA ADS] [CrossRef] [Google Scholar]
- Vega, O., Bressan, A., Panuzzo, P., et al. 2010, ApJ, 721, 1090 [NASA ADS] [CrossRef] [Google Scholar]
- Yan, R., Newman, J. A., Faber, S. M., et al. 2006, ApJ, 648, 281 [NASA ADS] [CrossRef] [Google Scholar]
All Tables
All Figures
|
Fig. 1 ETGs in the sample of Kormendy et al. (2009). MIR classes are colour coded (black = class 0; yellow = class 1; green = class 2; and red = class 4. Nebular lines in the spectra are indicated with vertical red solid lines. PAH complexes are indicated with dotted areas. H2 rotational emission lines are indicated with black solid lines. |
| In the text | |
|
Fig. 2 Ks-band absolute magnitude, MK, distribution vs. MIR classes (top panels) and cuspy/core ETGs in the Virgo plus Fornax clusters (Côté et al. 2006; Turner et al. 2012) (left panel) and in the total sample, including ETGs in low-density environments in Krajnović et al. (2013b). |
| In the text | |
|
Fig. 3 Specific baryonic angular momentum, λre/ 2, vs. average ellipticity, ϵre/ 2, measured for the 41 ETGs in Table 2 (see references in the table caption.) The solid line separates FRs from SRs according to Emsellem et al. (2011). The dashed line separates ETGs with cuspy profiles (large circles) from core galaxies (large squares) in the sample of Lauer (2012). MIR classes are coded as follows: square = class 0; cross = class 1; full dot = class 2; star = class 3, and diamonds = class 4. |
| In the text | |
Current usage metrics show cumulative count of Article Views (full-text article views including HTML views, PDF and ePub downloads, according to the available data) and Abstracts Views on Vision4Press platform.
Data correspond to usage on the plateform after 2015. The current usage metrics is available 48-96 hours after online publication and is updated daily on week days.
Initial download of the metrics may take a while.