Free Access
Fig. 2
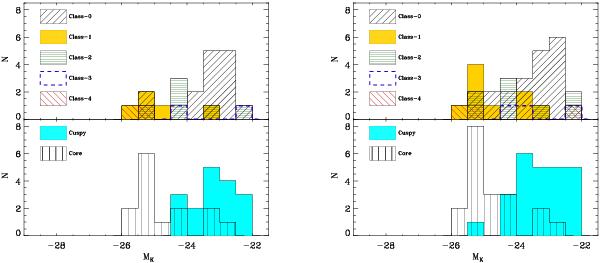
Ks-band absolute magnitude, MK, distribution vs. MIR classes (top panels) and cuspy/core ETGs in the Virgo plus Fornax clusters (Côté et al. 2006; Turner et al. 2012) (left panel) and in the total sample, including ETGs in low-density environments in Krajnović et al. (2013b).
This figure is made of several images, please see below:
Current usage metrics show cumulative count of Article Views (full-text article views including HTML views, PDF and ePub downloads, according to the available data) and Abstracts Views on Vision4Press platform.
Data correspond to usage on the plateform after 2015. The current usage metrics is available 48-96 hours after online publication and is updated daily on week days.
Initial download of the metrics may take a while.