Fig. 8
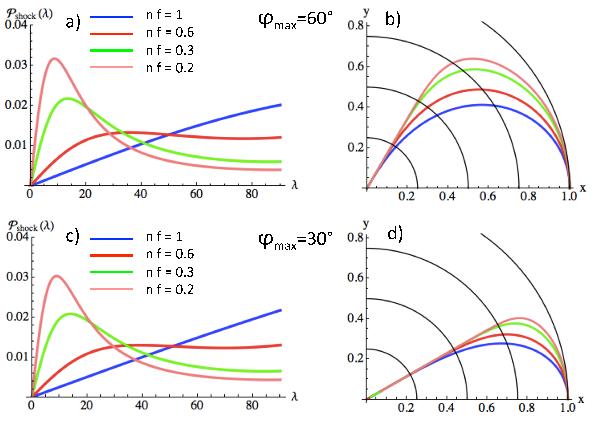
a) Synthetic probability distributions
 for the shock fronts as derived from the cosine model (see Sect. 3.2) and for different products nf ranging from
0.2 to 1 with ϕmax =
60° (defined in Fig. 7). b) Corresponding shock front shapes (in the quarter
x,y > 0) with the apex
distance normalized to 1. c), d) Same graphs with ϕmax =
30°.
for the shock fronts as derived from the cosine model (see Sect. 3.2) and for different products nf ranging from
0.2 to 1 with ϕmax =
60° (defined in Fig. 7). b) Corresponding shock front shapes (in the quarter
x,y > 0) with the apex
distance normalized to 1. c), d) Same graphs with ϕmax =
30°.
Current usage metrics show cumulative count of Article Views (full-text article views including HTML views, PDF and ePub downloads, according to the available data) and Abstracts Views on Vision4Press platform.
Data correspond to usage on the plateform after 2015. The current usage metrics is available 48-96 hours after online publication and is updated daily on week days.
Initial download of the metrics may take a while.