Fig. 12
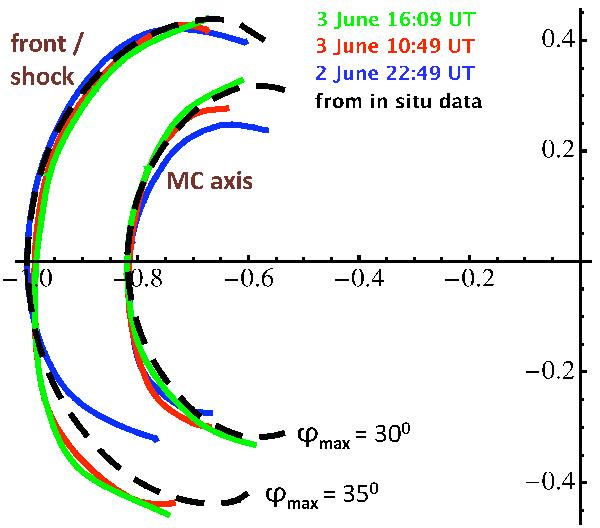
Comparison of the shock/front and MC-axis shapes deduced from in situ observations (in dashed black lines) with the corresponding shapes of a flux-rope that is imaged by STEREO-A HI 1 (shown at three times with color lines, Möstl et al. 2009). The shock shape (dashed black line) is deduced from Eqs. (15) and (16) for fICME = − 1 to 2, while the front shapes are set at the largest gradient intensity in HI 1 images. The axis shapes are from Janvier et al. (2013).
Current usage metrics show cumulative count of Article Views (full-text article views including HTML views, PDF and ePub downloads, according to the available data) and Abstracts Views on Vision4Press platform.
Data correspond to usage on the plateform after 2015. The current usage metrics is available 48-96 hours after online publication and is updated daily on week days.
Initial download of the metrics may take a while.