Fig. 16
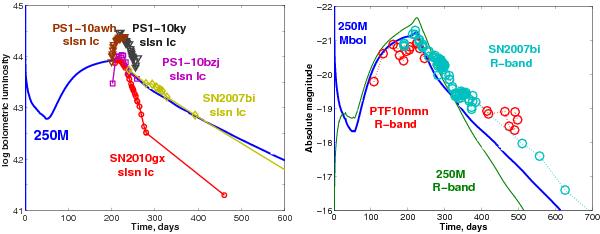
Left panel: absolute bolometric light curve for our 250 M⊙ PISN model (blue solid curve) and quasi-bolometric and bolometric light curves of superluminous type Ic SN 2010gx (red circles, Inserra et al. 2013), PS1-10awh and PS1-10ky (brown and black triangles, Chomiuk et al. 2011), PS1-10bzj (magenta squares, Lunnan et al. 2013), and SN 2007bi (yellow diamonds, Young et al. 2010). Right panel: absolute R-band (thin green line) and bolometric (thick blue line) light curve for our 250 M⊙ PISN model, and R-band data for SLSN 2007bi (cyan circles) and PTF-10nmn (red circles) (Gal-Yam 2012b).
Current usage metrics show cumulative count of Article Views (full-text article views including HTML views, PDF and ePub downloads, according to the available data) and Abstracts Views on Vision4Press platform.
Data correspond to usage on the plateform after 2015. The current usage metrics is available 48-96 hours after online publication and is updated daily on week days.
Initial download of the metrics may take a while.