Free Access
Fig. 14
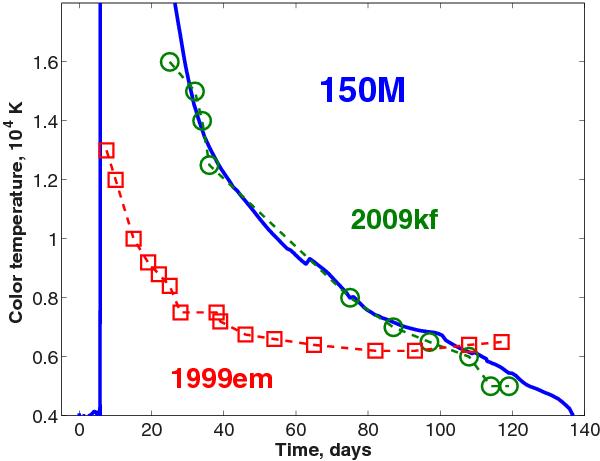
Color temperature evolution of 150 M⊙ PISN (solid line) and of typical SN IIP SN 1999em (squares) and NUV-bright SN 2009kf (circles) Bersten & Hamuy (2009); Botticella et al. (2010). SN 2009kf data are shifted in time by 15 days.
Current usage metrics show cumulative count of Article Views (full-text article views including HTML views, PDF and ePub downloads, according to the available data) and Abstracts Views on Vision4Press platform.
Data correspond to usage on the plateform after 2015. The current usage metrics is available 48-96 hours after online publication and is updated daily on week days.
Initial download of the metrics may take a while.