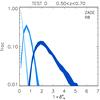
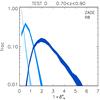
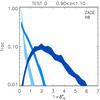
Fig. 8
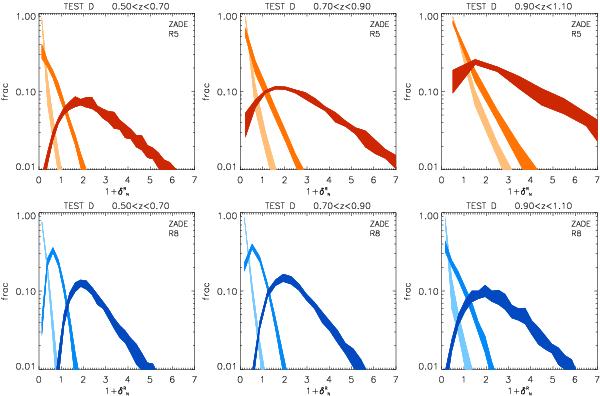
Distributions of reference overdensities for the spheres falling in the first, third and fifth quintiles of the density distribution computed in Test D, using ZADE. Left, middle and right panels are for the three redshift bins 0.5 < z < 0.7, 0.7 < z < 0.9 and 0.9 < z < 1.1, with tracers with MB − log 10(h) ≤ − 18.9 − z, MB − log 10(h) ≤ − 19.4 − z and MB − log 10(h) ≤ − 19.9 − z, respectively. Shades of red (top) are for cells with R = 5 h-1 Mpc, while shades of blue (bottom) are for cells with R = 8 h-1 Mpc. For both radii, colours from light to dark are for the first, third and fifth quintiles of the Test D density distribution. Bins on the x-axis are different in all panels (for smoothing purposes), so normalisation is not comparable among panels. All distributions are normalised to unity. Results obtained with the LNP method are very similar. See also Table 2.
Current usage metrics show cumulative count of Article Views (full-text article views including HTML views, PDF and ePub downloads, according to the available data) and Abstracts Views on Vision4Press platform.
Data correspond to usage on the plateform after 2015. The current usage metrics is available 48-96 hours after online publication and is updated daily on week days.
Initial download of the metrics may take a while.