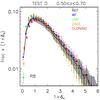
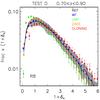
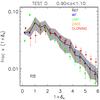
Fig. 7
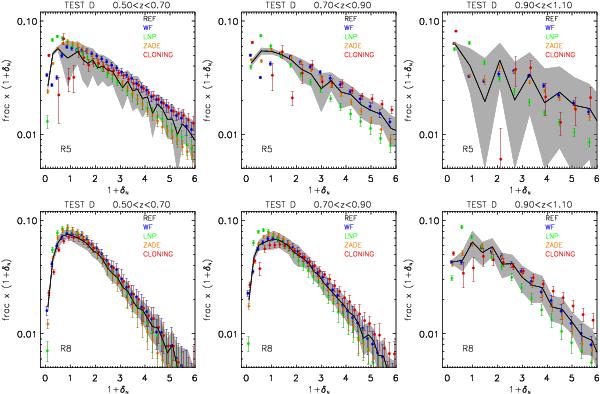
Distributions of the reference (black line) and Test D overdensities (points) for the three redshift bins 0.5 < z < 0.7, 0.7 < z < 0.9, and 0.9 < z < 1.1 (from left to right), with tracers with MB − log 10(h) ≤ − 18.9 − z, MB − log 10(h) ≤ − 19.4 − z, and MB − log 10(h) ≤ − 19.9 − z, respectively. Top row is for cells with R = 5 h-1 Mpc, bottom row for cells with R = 8 h-1 Mpc. Different colours are for different methods, as specified in the label: WF (blue), LNP (green), ZADE (orange), cloning (red). Grey-shaded area is the rms around the black line, computed using the 26 light cones. To better appreciate the differences among the series of points, the 1 + δN distribution on the y-axis has been multiplied by the corresponding value of 1 + δN itself.
Current usage metrics show cumulative count of Article Views (full-text article views including HTML views, PDF and ePub downloads, according to the available data) and Abstracts Views on Vision4Press platform.
Data correspond to usage on the plateform after 2015. The current usage metrics is available 48-96 hours after online publication and is updated daily on week days.
Initial download of the metrics may take a while.