Fig. 6
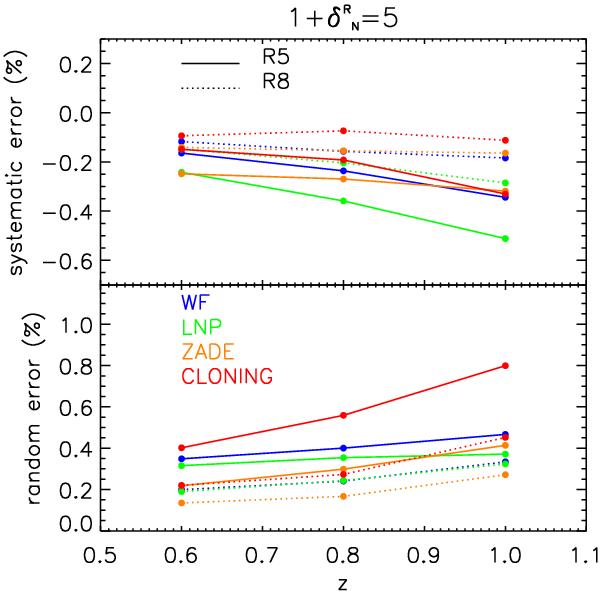
Systematic (top) and random (bottom) relative
errors in the reconstruction of  in Test
D, in the 3 redshift bins considered in this study (x-axis). We only
show results for
in Test
D, in the 3 redshift bins considered in this study (x-axis). We only
show results for  , but trends with redshift
are similar for other values. These values correspond, respectively, to the thick
and thin lines in the bottom panels of Fig. 5, for the given value.
The value of the scatter is obtained by averaging the lower and upper values of
the scatter (the two thin lines in Fig. 5).
Solid line is for R5 and dotted line for
R8. Different colours correspond
to the different methods (blue: WF; green: LNP; orange: ZADE; red: cloning).
, but trends with redshift
are similar for other values. These values correspond, respectively, to the thick
and thin lines in the bottom panels of Fig. 5, for the given value.
The value of the scatter is obtained by averaging the lower and upper values of
the scatter (the two thin lines in Fig. 5).
Solid line is for R5 and dotted line for
R8. Different colours correspond
to the different methods (blue: WF; green: LNP; orange: ZADE; red: cloning).
Current usage metrics show cumulative count of Article Views (full-text article views including HTML views, PDF and ePub downloads, according to the available data) and Abstracts Views on Vision4Press platform.
Data correspond to usage on the plateform after 2015. The current usage metrics is available 48-96 hours after online publication and is updated daily on week days.
Initial download of the metrics may take a while.