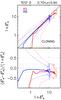
Fig. 5
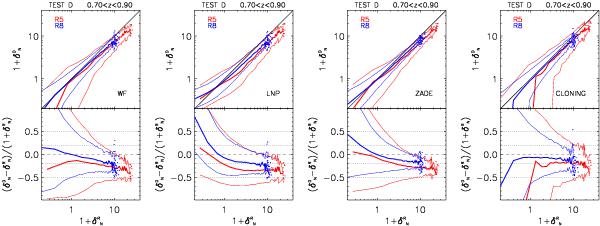
Comparison of overdensities for Test D, for WF, LNP, ZADE, and cloning
(from left to right), for the redshift bin 0.7
< z <
0.9 and tracers with MB −
log 10(h) ≤ −19.4 −
z. x-axis: overdensity in the reference
catalogue ( );
y-axis, top panels: overdensity
in the test catalogue (
);
y-axis, top panels: overdensity
in the test catalogue ( );
y-axis, bottom panels: relative
error (
);
y-axis, bottom panels: relative
error ( ). The thick lines are
the median value of the quantity displayed on the y-axis in each given
x-axis bin. Thin lines represent the 16th and
84th percentiles of its distribution. Points are single cells, when cells per bin
are <20 (in which case we do not compute a
median and percentiles). Red and blue lines/symbols are for spheres with radius
R5 and R8,
respectively. See text for details about tests.
). The thick lines are
the median value of the quantity displayed on the y-axis in each given
x-axis bin. Thin lines represent the 16th and
84th percentiles of its distribution. Points are single cells, when cells per bin
are <20 (in which case we do not compute a
median and percentiles). Red and blue lines/symbols are for spheres with radius
R5 and R8,
respectively. See text for details about tests.
Current usage metrics show cumulative count of Article Views (full-text article views including HTML views, PDF and ePub downloads, according to the available data) and Abstracts Views on Vision4Press platform.
Data correspond to usage on the plateform after 2015. The current usage metrics is available 48-96 hours after online publication and is updated daily on week days.
Initial download of the metrics may take a while.