Fig. 4
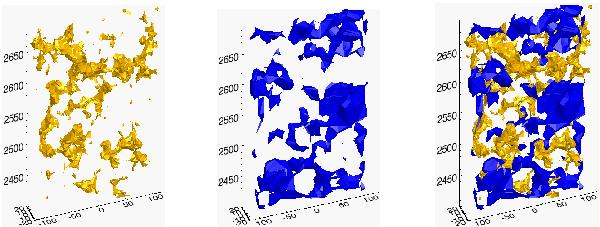
The 3D VIPERS density field obtained by filling gaps with the cloning method and computing the density within Voronoi volumes. Left: the isosurface enclosing the highest densities. Centre: the isosurface enclosing the lowest densities. Right: the isosurfaces of lowest and highest densities overplotted. One can see clearly that the highest densities form filamentary structures, while the lowest densities enclose more spherical regions. The plot shows the W1 field with RA < 35.3 deg to avoid the missing pointing at RA ~ 35.5. Axes are in comoving coordinates (expressed in h-1 Mpc): x and y are arbitrarily centred on the RA–Dec centre of the considered field, and the z-axis corresponds to the redshift range 0.65 ≲ z ≲ 0.75.
Current usage metrics show cumulative count of Article Views (full-text article views including HTML views, PDF and ePub downloads, according to the available data) and Abstracts Views on Vision4Press platform.
Data correspond to usage on the plateform after 2015. The current usage metrics is available 48-96 hours after online publication and is updated daily on week days.
Initial download of the metrics may take a while.