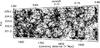
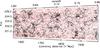
Fig. 2
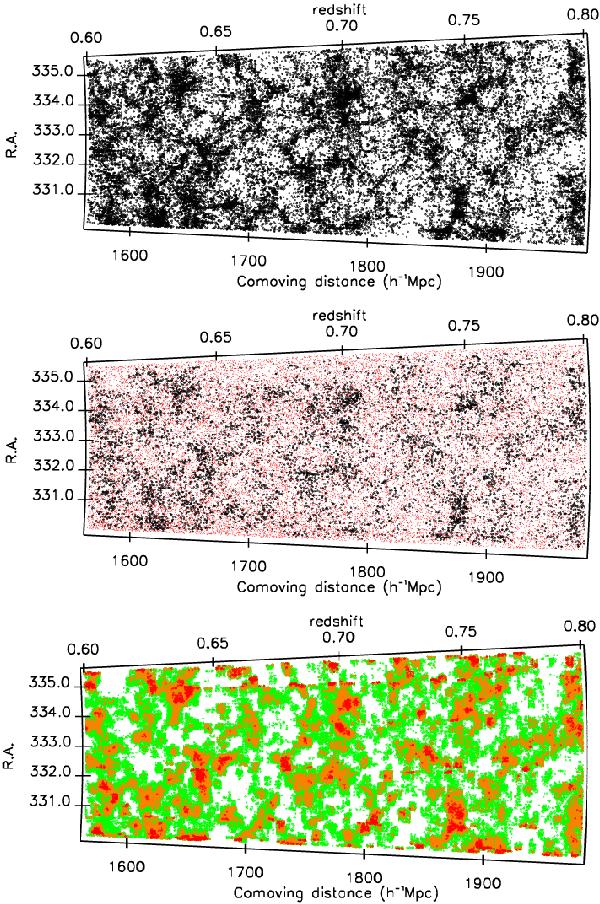
2D distribution of galaxies (where the projected Dec covers a range of 1.5°) in one of the W4 field mock catalogues used in this work. Top: all galaxies in the reference mock catalogue (100% sampling rate, the redshift includes cosmological redshift and peculiar velocity). Middle: galaxies in the Test D mock catalogue (see Sect. 4.1 for more details). The catalogue includes ~35% of galaxies in quadrants (black points) with spectroscopic redshift, while the remaining 65% in quadrants and all the galaxies in gaps have a photometric redshift (red dots). Bottom: equal probability contours for the ZADE probability function P(zi) (see Sect. 3.1 for details). Colour code is set according to the statistical weight wZADE. Red: wZADE ≥ 0.2, Orange: 0.1 ≤ wZADE < 0.2. Green: 0.05 ≤ wZADE < 0.1.
Current usage metrics show cumulative count of Article Views (full-text article views including HTML views, PDF and ePub downloads, according to the available data) and Abstracts Views on Vision4Press platform.
Data correspond to usage on the plateform after 2015. The current usage metrics is available 48-96 hours after online publication and is updated daily on week days.
Initial download of the metrics may take a while.