Fig. 6
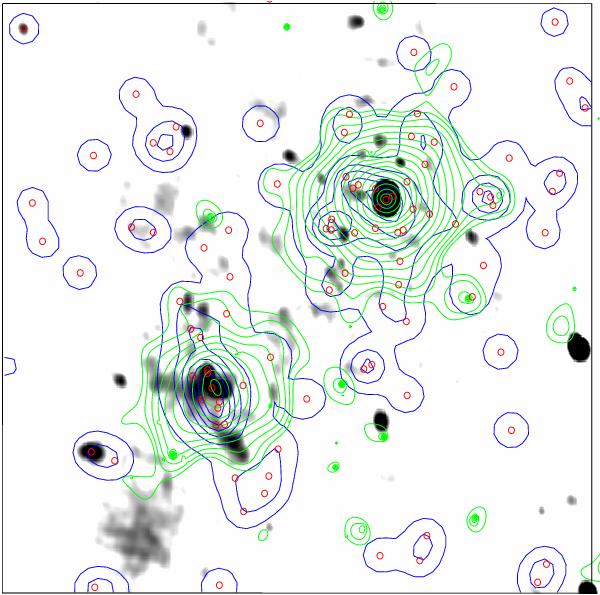
Galaxy isodensity map (blue contours), with overlaid the X-ray Chandra contours (green, same as in Fig. 4). The radio image (same as in Fig. 2, left) is shown in greyscale (with the lowest level corresponding to 3σ323 MHz = 0.82 mJy/b). Only galaxies in the magnitude range R = (17.8–21) and in the colour range 3.4 μm – R = (3.5–4.5) have been used, and their spatial distribution is shown by red circles.
Current usage metrics show cumulative count of Article Views (full-text article views including HTML views, PDF and ePub downloads, according to the available data) and Abstracts Views on Vision4Press platform.
Data correspond to usage on the plateform after 2015. The current usage metrics is available 48-96 hours after online publication and is updated daily on week days.
Initial download of the metrics may take a while.