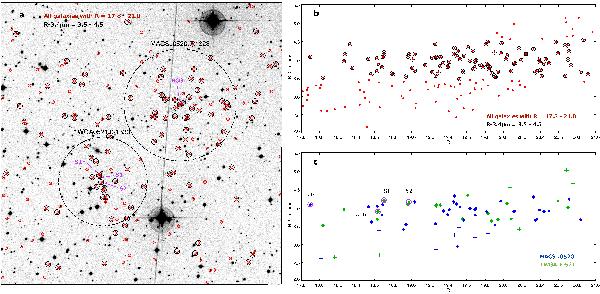
Fig. 5

a) DSS–R image of the ~19′× 19′ area around M0520 (same as in Fig. 1, Right panel); dashed circles have radii r500 and are centred on the X-ray centre of each cluster. The red small circles mark the galaxies selected in the range R = 17.8–21.0; the large black circles show only those galaxies within the range of colours R − 3.4 μm = 3.5–4.5. b) R − 3.4 μm CMD of the galaxies within the ~19′× 19′ area as in panel a) red and black circles as in panel a). c) R − 3.4 μm CMD of the galaxies within the dashed circles in panel a) the crosses are all the galaxies in the range R = 17.8 − 21.0, the filled dots are the colour-selected once (R − 3.4 μm = 3.5–4.5) .The BCG of M 0520 and the optical counterparts of radio sources S1 and S2 are marked by magenta circles (they are also highlighted by magenta arrows in panel a), for clarity).
Current usage metrics show cumulative count of Article Views (full-text article views including HTML views, PDF and ePub downloads, according to the available data) and Abstracts Views on Vision4Press platform.
Data correspond to usage on the plateform after 2015. The current usage metrics is available 48-96 hours after online publication and is updated daily on week days.
Initial download of the metrics may take a while.


