Fig. 29
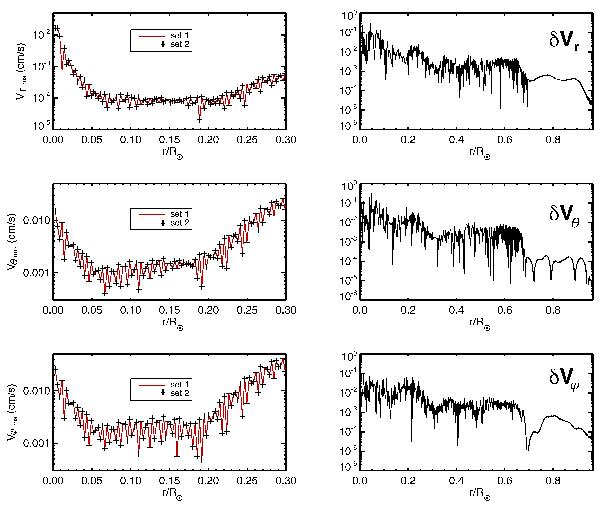
Left: radial and horizontal rms velocities as a function of the normalized radius for model ref (red line, calculated with set 1) and the same model (black crosses) calculated with set 2 at time t ≈ 90 days. Both curves are almost perfectly superimposed. Right: difference between both models in percent:  , where v1 corresponds to model ref and v2 to the other one. The difference at r = 0 is about 0.1% and much less in the rest of the sphere.
Current usage metrics show cumulative count of Article Views (full-text article views including HTML views, PDF and ePub downloads, according to the available data) and Abstracts Views on Vision4Press platform.
Data correspond to usage on the plateform after 2015. The current usage metrics is available 48-96 hours after online publication and is updated daily on week days.
Initial download of the metrics may take a while.