Fig. 22
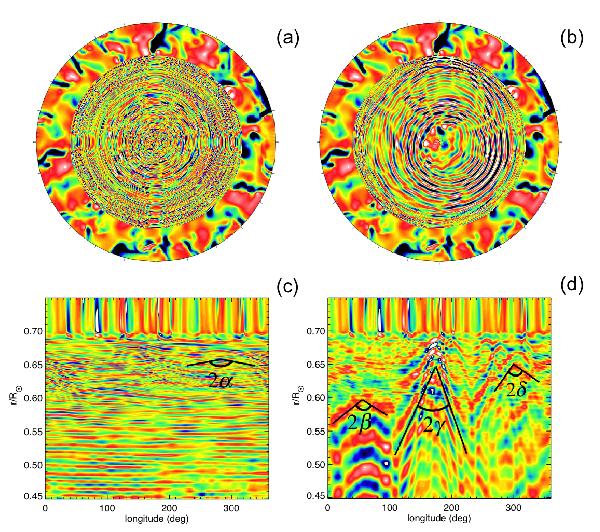
Comparison between fully nonlinear model turb2 in panels a) and c) and semi-linear model sem-lin in panels b) and d). The quantity represented is the normalized radial velocity. Both top panels are equatorial slices where we see the outer convective region (red/blue tones denote positive/negative values). The cross shape visible in the radiative zone in top left panel is a Moiré pattern. In the bottom panels, we have zoomed in the upper part of the radiative zone to highlight the departure of wavefronts from the base of plumes. We can measure the angle formed by the wavefronts in both situations and deduce that nonlinear interactions favor low-frequency waves.
Current usage metrics show cumulative count of Article Views (full-text article views including HTML views, PDF and ePub downloads, according to the available data) and Abstracts Views on Vision4Press platform.
Data correspond to usage on the plateform after 2015. The current usage metrics is available 48-96 hours after online publication and is updated daily on week days.
Initial download of the metrics may take a while.