Fig. 16
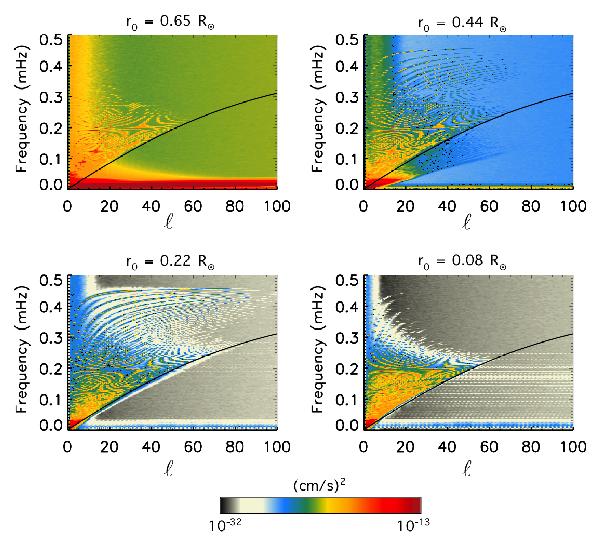
Variation in the spectrum shape as function of depth r0 (model ref). The black line marks the last resolved ridge n = 58 common to all depths. We have volontarily cut the horizontal axis to ℓ = 100 to show the part where ridges are the most visible and used the same color table for the four depths, although the minimum and maximum amplitudes vary greatly. In particular, the change in the background color shows the increase in the background noise when reaching the excitation zone (r0 = 0.65 R⊙) and then entering the convective region.
Current usage metrics show cumulative count of Article Views (full-text article views including HTML views, PDF and ePub downloads, according to the available data) and Abstracts Views on Vision4Press platform.
Data correspond to usage on the plateform after 2015. The current usage metrics is available 48-96 hours after online publication and is updated daily on week days.
Initial download of the metrics may take a while.