Fig. 11
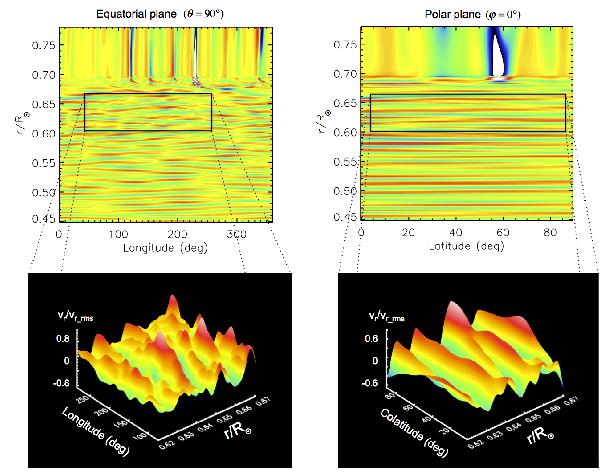
Form of the wavefronts in the equatorial and polar planes. Top: contour plots of the normalized radial velocity in the equatorial (left) and polar (right) planes zoomed in the upper region of the radiative zone. Bottom: surface plots corresponding to the region delimited by the black rectangles in the top panel that show the amplitude of the wavefronts varying with longitude (left) and colatitude (right). The velocity has been divided by its rms value at each radius, in order to visualize the form of the wavefront despite the attenuation of the amplitude.
Current usage metrics show cumulative count of Article Views (full-text article views including HTML views, PDF and ePub downloads, according to the available data) and Abstracts Views on Vision4Press platform.
Data correspond to usage on the plateform after 2015. The current usage metrics is available 48-96 hours after online publication and is updated daily on week days.
Initial download of the metrics may take a while.