Fig. 10
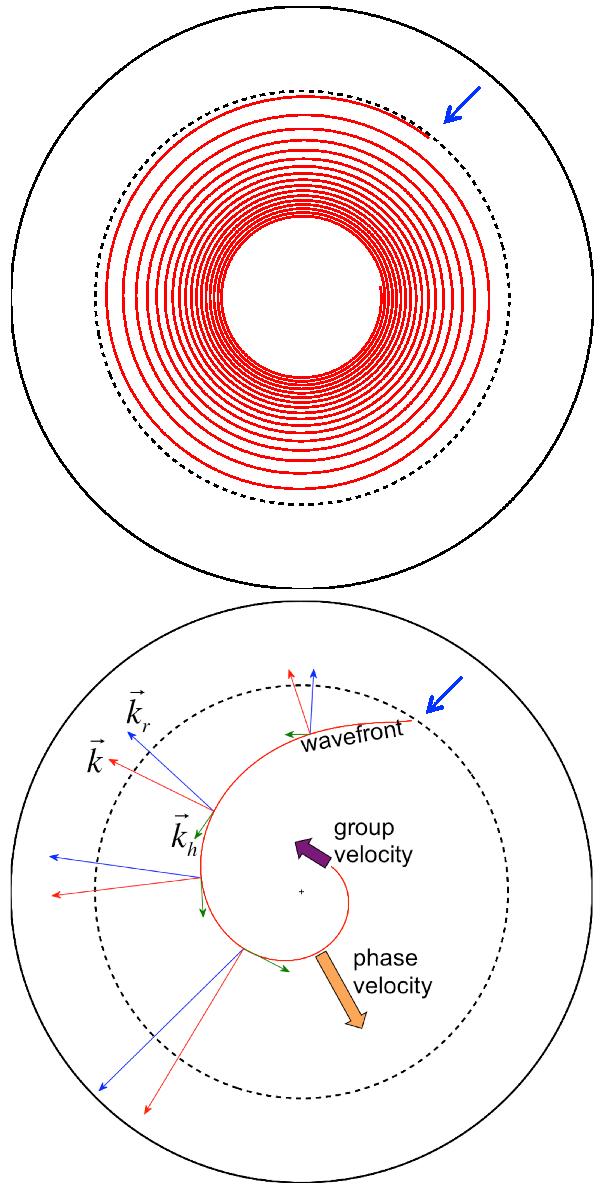
Propagation of two gravity waves calculated by raytracing. The top panel shows a wave at the low-frequency ω1 = 3 × 10⁻³ mHz. The ray spirals toward the center with an almost radial wavevector, i.e., kh ≪ kr. In the bottom panel, a higher frequency wave with ω2 = 0.2 mHz is represented with arrows indicating the directions of k, kr, and kh. The scale is respected, so  . Blue arrows in the top right of each panel point out the place where both waves are excited.
Current usage metrics show cumulative count of Article Views (full-text article views including HTML views, PDF and ePub downloads, according to the available data) and Abstracts Views on Vision4Press platform.
Data correspond to usage on the plateform after 2015. The current usage metrics is available 48-96 hours after online publication and is updated daily on week days.
Initial download of the metrics may take a while.