Fig. 1
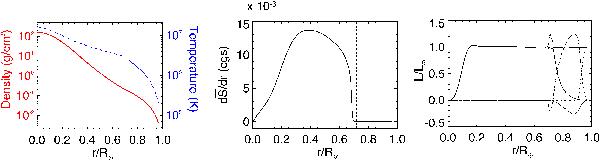
Left: radial profiles of the reference density  (red/solid line) and temperature
  (blue/dotted line) as a function of the normalized radius. Middle: radial profiles of the entropy gradient. The vertical dotted line marks the radius where d
 /dr changes sign. It corresponds to the initial limit between convective and radiative zones. Right: radial energy flux balance converted into luminosity and normalized to the solar luminosity L⊙. The values have been averaged over latitude, longitude and time (≈30 days). We show the contribution to the energy flux from radiative diffusion (long dashes), enthalpy (three-dot-dashed), kinetic energy (dash-dot), modeled SGS processes (dot), and viscous diffusion (dashes). The solid line is the sum of all these components.
Current usage metrics show cumulative count of Article Views (full-text article views including HTML views, PDF and ePub downloads, according to the available data) and Abstracts Views on Vision4Press platform.
Data correspond to usage on the plateform after 2015. The current usage metrics is available 48-96 hours after online publication and is updated daily on week days.
Initial download of the metrics may take a while.