Fig. 3
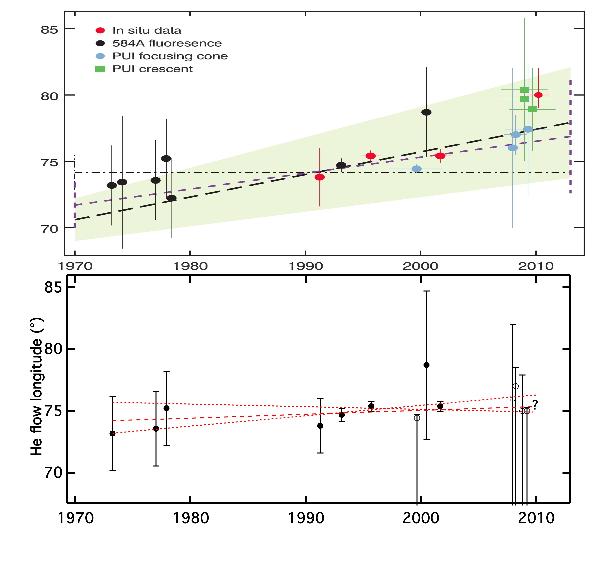
Top: the original figure from Frisch et al. (2013) showing the inferred temporal increase of the helium wind longitude. Bottom: our revisited set of appropriate measurements. Filled circles are the data points we consider for linear fits. Longitudes derived from PUI data (augmented by 2σ) serve only as upper limits. Shown are the central, upper, and lower trends allowed by the fits. Stationarity is contained within the solutions. The question mark corresponds to the IBEX period and the Witte et al. longitude, not included in the fit (the IBEX-Lo result is also not included, according to Sect. 2). PUI data points are slightly displaced in the figure to avoid overlap.
Current usage metrics show cumulative count of Article Views (full-text article views including HTML views, PDF and ePub downloads, according to the available data) and Abstracts Views on Vision4Press platform.
Data correspond to usage on the plateform after 2015. The current usage metrics is available 48-96 hours after online publication and is updated daily on week days.
Initial download of the metrics may take a while.