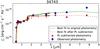
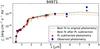
Fig. 14
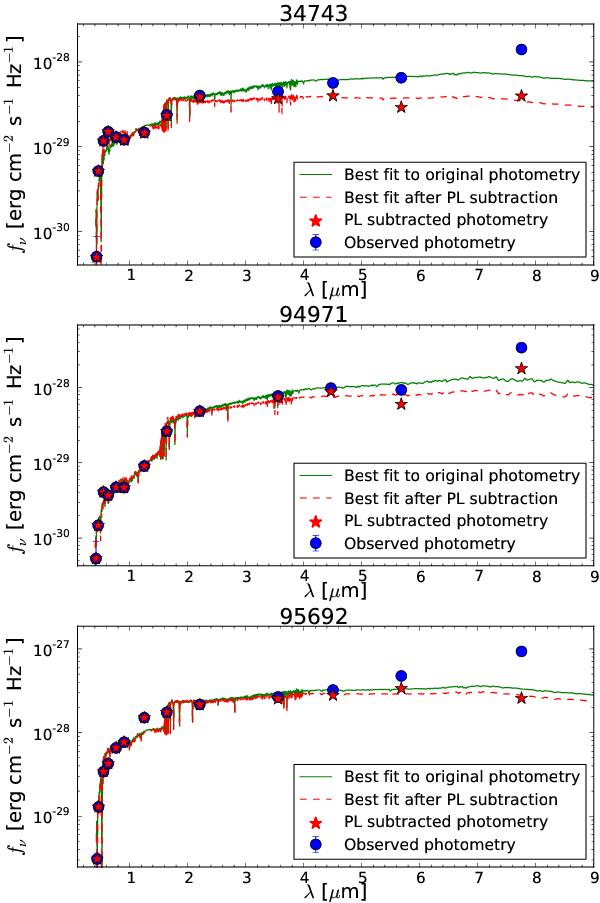
The best-fit models for galaxies with a significant PL component, plotted with the observed broadband fluxes. The red (green) line are the best-fit models with (without) a PL component. The blue points with error bars are the observed broadband fluxes (note that most of the error margins are so small that the bars are covered by the points).
Current usage metrics show cumulative count of Article Views (full-text article views including HTML views, PDF and ePub downloads, according to the available data) and Abstracts Views on Vision4Press platform.
Data correspond to usage on the plateform after 2015. The current usage metrics is available 48-96 hours after online publication and is updated daily on week days.
Initial download of the metrics may take a while.