Fig. 3
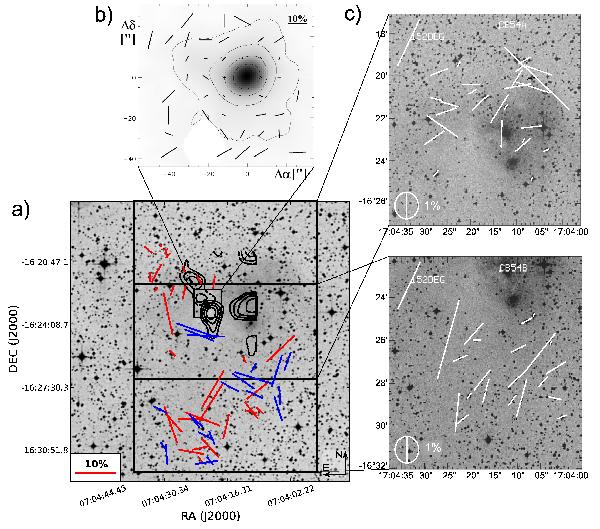
CB54 – a) DSS-map with overlaid near-IR polarization vectors observed with ISAAC/VLT. The length of the vectors shows the degree of polarization, and the direction gives the position angle. Only vectors with P/σP > 3 are plotted. Blue vectors have a better error statistic than the red vectors, since they are based on more than one set of observations. The contour lines represent the 12CO(1–0) spectral channel maps obtained with the Five College Radio Astronomy Observatory. The solid contour lines give the blueshifted (south-western), and the dotted contour lines give the redshifted (north-eastern) outflow lobe. Contour levels are spaced at 0.3 K km s-1 intervals of 1.7 K km s-1 (blue), and 0.15 K km s-1 intervals of 0.45 K km s-1 (red), respectively (from Yun & Clemens 1994, beam size of 48′′; reproduced by permission of the AAS). b) Intensity map overlaid with polarization vectors obtained with SCUBA/JCMT in the sub-mm (Henning et al. 2001, reproduced by permission of the AAS). c) Intensity map overlaid with polarization vectors obtained with IMPOL/GIRT in the optical (Sen et al. 2000).
Current usage metrics show cumulative count of Article Views (full-text article views including HTML views, PDF and ePub downloads, according to the available data) and Abstracts Views on Vision4Press platform.
Data correspond to usage on the plateform after 2015. The current usage metrics is available 48-96 hours after online publication and is updated daily on week days.
Initial download of the metrics may take a while.