Fig. 1
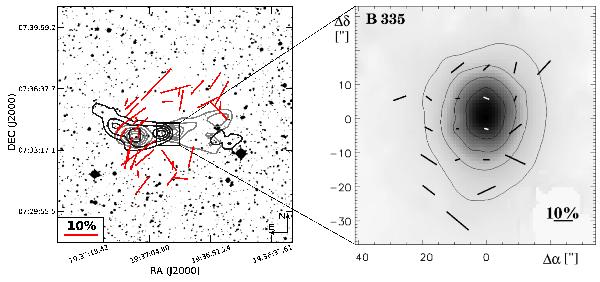
B335 – Left: DSS-map with overlaid near-IR polarization vectors observed with ISAAC/VLT. The length of the vectors shows the degree of polarization, and the direction gives the position angle. Only vectors with P/σP > 3 are plotted. The contour lines represent the 12CO(2–1) OTF channel maps obtained with the HHT on Mount Graham. The black (gray) contour lines give the blueshifted (redshifted) eastern (western) outflow lobe. The contour levels are  (from Stutz et al. 2008, beam size of 32′′; reproduced by permission of the AAS). Right: intensity map overlaid with polarization vectors obtained with SCUBA/JCMT in the sub-mm (Wolf et al. 2003, reproduced by permission of the AAS).
Current usage metrics show cumulative count of Article Views (full-text article views including HTML views, PDF and ePub downloads, according to the available data) and Abstracts Views on Vision4Press platform.
Data correspond to usage on the plateform after 2015. The current usage metrics is available 48-96 hours after online publication and is updated daily on week days.
Initial download of the metrics may take a while.