| Issue |
A&A
Volume 565, May 2014
|
|
|---|---|---|
| Article Number | A3 | |
| Number of page(s) | 12 | |
| Section | Extragalactic astronomy | |
| DOI | https://doi.org/10.1051/0004-6361/201322962 | |
| Published online | 18 April 2014 | |
Carbon and oxygen isotope ratios in starburst galaxies: New data from NGC 253 and Mrk 231 and their implications
1
Max-Planck-Institut für Radioastronomie,
Auf dem Hügel 69, 53121
Bonn,
Germany
e-mail:
This email address is being protected from spambots. You need JavaScript enabled to view it.
2
Astronomy Department, Faculty of Science, King Abdulaziz
University, PO Box
80203, 21589
Jeddah, Saudi
Arabia
3
Purple Mountain Observatory, Chinese Academy of
Sciences, 21008
Nanjing, PR
China
4
National Astronomical Observatory of Japan,
2–21–1 Osawa, Mitaka, 181–8588
Tokyo,
Japan
5
Dept. of Earth and Space Sciences, Chalmers University of
Technology, Onsala Observatory, 43994
Onsala,
Sweden
6
Institute for Computational Cosmology, Dept. of Physics, Durham
University, South
Road, Durham
DH1 3LE,
UK
7
School of Physics, Cardiff University,
Queens Building, The Parade,
Cardiff
CF24 3AA,
UK
8
European Southern Observatory, Karl-Schwarzschild-Strasse 2, 85748
Garching,
Germany
9
Observatorio Astronómico Nacional (OAN) – Observatorio de
Madrid, Alfonso XII,
3, 28014
Madrid,
Spain
10
European Southern Observatory, Avda. Alonso de Córdova 3107, Vitacura, Casilla
19001, Santiago,
Chile
11
Institute de Radioastronomie Millimétrique,
rue de la Piscine 300,
38406 Saint-Martin
d’Hères,
France
Received:
31
October
2013
Accepted:
18
February
2014
Abstract
Carbon and oxygen isotope ratios are excellent measures of nuclear processing, but few such data have been taken toward extragalactic targets so far. Therefore, using the IRAM 30-m telescope, CN and CO isotopologues have been measured toward the nearby starburst galaxy NGC 253 and the prototypical ultraluminous infrared galaxy Mrk 231. Toward the center of NGC 253, the CN and 13CN N = 1 → 0 lines indicate no significant deviations from expected local thermodynamical equilibrium after accounting for moderate saturation effects (10 and 25%) in the two detected spectral components of the main species. Including calibration uncertainties, which dominate the error budget, the 12C/13C ratio becomes 40 ± 10. This is larger than the ratio in the central molecular zone of the Galaxy, suggesting a higher infall rate of poorly processed gas toward the central region. Assuming that the ratio also holds for the CO emitting gas, this yields 16O/18O = 145 ± 36 and 16O/17O = 1290 ± 365 and a 32S/34S ratio close to the one measured for the local interstellar medium (20–25). No indication of vibrationally excited CN is found in the lower frequency fine structure components of the N = 1 → 0 and 2 → 1 transitions at rms noise levels of 3 and 4 mK (15 and 20 mJy) in 8.5 km s-1 wide channels. Peak line intensity ratios between NGC 253 and Mrk 231 are ~100 for 12C16O and 12C18O J = 1 → 0, while the ratio for 13C16O J = 1 → 0 is ~250. This and similar 13CO and C18O line intensities in the J = 1 → 0 and 2 → 1 transitions of Mrk 231 suggest 12C/13C ~ 100 and 16O/18O ~ 100, in agreement with values obtained for the less evolved ultraluminous merger Arp 220. Also, when accounting for other (scarcely available) extragalactic data, 12C/13C ratios appear to vary over a full order of magnitude, from >100 in ultraluminous high redshift galaxies to ~100 in more local such galaxies to ~40 in weaker starbursts that are not undergoing a large scale merger to 25 in the central molecular zone of the Milky Way. With 12C being predominantly synthesized in massive stars, while 13C is mostly ejected by longer lived lower mass stars at later times, this is qualitatively consistent with our results of decreasing carbon isotope ratios with time and rising metallicity. It is emphasized, however, that both infall of poorly processed material, initiating a nuclear starburst, and the ejecta from newly formed massive stars (in particular in the case of a top-heavy stellar initial mass function) can raise the carbon isotope ratio for a limited amount of time.
Key words: galaxies: starburst / galaxies: abundances / galaxies: ISM / nuclear reactions, nucleosynthesis, abundances / galaxies: individual: NGC 253 / galaxies: individual: Mrk 231
© ESO, 2014
1. Introduction
When studying stellar nucleosynthesis and chemical enrichment, it is difficult to optically distinguish isotopes of a given element, since their atomic lines are blended. However, microwave lines from rare isotopic substitutions of a given molecular species, so-called “isotopologues”, are separated well from their parent molecule, typically by a few percent of their rest frequency. Thus, the frequencies of the main and rare species are close enough to be observed with the same technical equipment but without the problem of blending.
A few years ago, it became apparent (Wouterloot et al. 2008; Wang et al. 2009) that with respect to its composition, the metal-poor outer Galaxy does not provide a “bridge” between the solar neighborhood and the even more metal-poor Large Magellanic Cloud (LMC). This can be explained by the different age of the bulk of the stellar populations of the outer Galaxy and the LMC and can be exemplified by one of the most thoroughly studied isotope ratios, that of carbon. The two stable isotopes, 12C and 13C, have been measured throughout the Galaxy, in prominent star forming regions of the LMC, and in a large number of stellar objects (e.g., Milam et al. 2005; Wang et al. 2009; Abia et al. 2012; Mikolaitis et al. 2012). The 12C/13C ratio is a measure of “primary” versus “secondary” processing. 12C is produced on rapid timescales primarily via He burning in massive stars. 13C is mainly produced via CNO processing of 12C seeds from earlier stellar generations. This occurs on a slower time scale during the red giant phase in low and intermediate mass stars or novae (for reviews, see Henkel et al. 1994; Wilson & Rood 1994).
Previous observations have demonstrated that the 12C/13C ratio can vary strongly within the Galaxy (e.g., Henkel et al. 1985; Stahl et al. 1989; Wouterloot & Brand 1996; Milam et al. 2005; Sheffer et al. 2007). In the outer Galaxy very high ratios of 12C/13C > 100 are found, and in the local interstellar medium 12C/13C ~ 70, while in the inner Galactic disk and LMC 12C/13C ~ 50. The solar system ratio is 89. Within the framework of “biased infall” (e.g., Chiappini & Matteucci 2001), the Galactic disk is slowly formed from inside out, which causes gradients in the abundances across the disk. The stellar 13C ejecta, which reach the interstellar medium with a time delay, are less dominant in the young stellar disk of the outer Galaxy than in the inner Galaxy and the old stellar body of the LMC (see, e.g., Hodge 1989 for the star formation history of the LMC). The solar system ratio, referring to a younger more 13C deficient disk, is therefore higher than is measured in the present local interstellar medium. Consistent with this idea, 12C/13C ratios are particularly low (~25) in the Galactic center region with its old bulge (e.g., Güsten et al. 1985), while inflowing or infalling gas from outside appears to be characterized by higher ratios (Riquelme et al. 2010). We note that this scenario also explains other isotope ratios based on differences in primary and secondary nucleosynthesis, such as for 16O (a product of massive stars, ≳8 M⊙) and 17O (a product of lower mass stars), while 18O is apparently synthesized most efficiently in metal-rich stars of high mass (e.g., Wouterloot et al. 2008).
With respect to isotope ratios, the extragalactic space beyond the Magellanic Clouds is almost unexplored and therefore very interesting to investigate (for previous pioneering efforts, see Aalto et al. 1991; Casoli et al. 1992; Henkel et al. 1993; 2010; Henkel & Mauersberger 1993; Wang et al. 2004; Muller et al. 2006; Martín et al. 2010; González-Alfonso et al. 2012; Danielson et al. 2013). What ratios can be found when observing objects outside the Local Group of galaxies at low and high redshifts and in environments, which differ drastically from those in the Milky Way and the LMC? Is the Galaxy typical of its class or are its isotopic properties exceptional? And what kind of isotopic compositions can be expected in optical lines when trying to determine high precision redshifts and to constrain variations in physical constants through time and space (e.g., Levshakov et al. 2006)?
In the following we present and analyze new CN and CO data from the nearby prototypical starburst galaxy NGC 253 and the ultraluminous merger Mrk 231, in order to derive and to compare the carbon isotope ratios in these different environments. Section 2 describes observations and data reduction. Section 3 presents the CN and CO measurements and data analysis toward NGC 253, including carbon and oxygen isotope ratios and CN excitation temperatures. In Sect. 4 we discuss our data from Mrk 231 and provide a general overview of extragalactic carbon isotope determinations in targets beyond the Magellanic Clouds. Section 5 summarizes the main results.
2. Observations
The λ ~ 3 and 1.3 mm measurements toward NGC 253 were obtained with the IRAM 30-m telescope (project 078–12) at Pico Veleta, Spain1, during August 5 and 6, 2012. Full width to half power beam widths (FWHPs) were about 22″ and 11″. The EMIR SiS receivers were employed with system temperatures of Tsys ~ 130, 240, 240, and 260 K at 109.6, 113.4 (λ ~ 3 mm), 221.3, and 225.0 GHz (λ ~ 1.3 mm) on an antenna temperature scale. Adopted beam and forward hemisphere efficiencies are 0.80 and 0.95 at λ ~ 3 mm and 0.62 and 0.92 at λ ~ 1.3 mm. As backend we used fast Fourier transform spectrometers with a channel spacing of 195.3 kHz, covering two contiguous 4 GHz segments in dual linear polarization at λ ~ 3 and also at λ ~ 1.3 mm. Channel spacings were 0.53 and 0.26 km s-1, respectively. The spectra were obtained with a wobbling secondary mirror using a switch cycle of a few seconds (2 s on-source, 2 s off-source) and a beam throw of ±100″. No absorption features are seen in any spectrum, potentially caused by using too small a beam throw. The pointing accuracy, based on nearby continuum sources, was accurate to ~5″. For calibration, see Sect. 3.6.2. Table 1 displays some essential parameters of the observations.
Observational parameters.
Complementary λ ~ 3 and 1.3 mm observations of Mrk 231 were taken in January and May 2011 (project 233–11) with the IRAM 30-m telescope using the same receivers and observing mode with the WILMA backend under varying weather conditions. This backend provided channel spacings of 2 MHz.
Data analysis was performed with the GILDAS data reduction package2, revealing excellent baselines only requiring the subtraction of baselines of order ≤2 for both galaxies. The λ = 3 and 1.3 mm data were taken simultaneously, and the pointing difference between the two EMIR receivers was found to be ≲2″.
3. CN and CO toward NGC 253
3.1. The galaxy NGC 253
The Sculptor galaxy NGC 253, an almost edge-on barred spiral (i = 72°–78°; Pence 1981; Puche et al. 1991), is one of the most prolific infrared and molecular lighthouses of the entire extragalactic sky. At a distance of D ~ 3 Mpc (e.g., Mouhcine et al. 2005; Rekola et al. 2005), it is a prime example of a galaxy with a nuclear starburst devoid of an active galactic nucleus (e.g., Ulvestad & Antonucci 1997; Henkel et al. 2004). Because of the exceptional strength of its molecular lines, NGC 253 was selected as the target of choice for the first unbiased molecular line survey of an extragalactic source (Martín et al. 2006). It is therefore a highly suitable target for this study.
3.2. Our data
CN spectra are complex. Each CN rotational energy level with N> 0 is split into a doublet by spin-rotation interaction. Because of the spin of the nitrogen nucleus (I1 = 1), each of these components is then split into a triplet of states. The 13CN spectrum is complicated further by the spin of the 13C (I2 = 1 /2) nucleus.
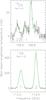 |
Fig. 1 CN N = 1 → 0 spectra (black) and Gaussian fits (green) from NGC 253 on a local standard of rest (LSR) VLSR = 0 km s-1 frequency scale. Both spectra are smoothed to a channel spacing of ~8.5 km s-1 (3.125 MHz). Lower panel: the J = 1/2 → 1 / 2 (left) and J = 3/2 → 1 /2 (right) groups of CN lines. Upper panel: the strongest feature is the 00 → 1-1 E line of CH3OH (methanol). Far left: the F1 = 0, F2 = 1 → 0 and F1 = 1, F2 = 1 → 1 groups of 13CN N = 1 → 0 lines. In between this spectral feature and the methanol line: the F1 = 1, F2 = 2 → 1 group of 13CN transitions (for CN and 13CN rest frequencies, see Skatrud et al. 1983; and Bogey et al. 1984). The emission on the righthand side of the methanol line near 108.9 GHz might be caused by SiS 6 → 5. Numbers at the foot of each spectral CN or 13CN feature provide expected relative intensities with respect to the weaker group of lines in case of optically thin emission under conditions of local thermodynamical equilibrium. For less sensitive CN spectra obtained with smaller bandwidths, see Fig. 1 of Henkel et al. (1993). |
Figure 1 shows our λ ~ 3 mm CN spectra. The lower panel displays the N = 1 → 0J = 1 /2 → 1/2 (left) and J = 3/2 → 1/2 (right) groups of lines of 12C14N (hereafter CN). The upper panel visualizes the blended N = 1 → 0F2 = 1 → 0 and 1 → 1 (far left) and the slightly weaker F2 = 2 → 1 (next feature to the right) transitions of 13C14N (hereafter 13CN). This represents one of the first detections of 13CN in extragalactic space (cf. Aladro et al. 2013; for the first detection in the local interstellar medium, see Gerin et al. 1984). The 13CN spectrum has an rms noise level of 2 mK (channel width: 8.5 km s-1). While the upper panel of Fig. 1 only shows a small spectral segment, we note that the entire spectrum has a width of 4 GHz. Therefore the (flat) baseline and noise level are well defined. Table 2 provides the corresponding line parameters. It should be emphasized that the Gaussian fit result for 13CN, fitting the two 13CN profiles and the dominant CH3OH feature simultaneously, is very robust.
CN line parameters of NGC 253, obtained from Gaussian fits.
A comparison with the approximate rest frequencies of the different groups of lines shows that we mainly see the high velocity component of NGC 253 with a recessional velocity of VLSR ~ + 290 km s-1 (e.g., Martín et al. 2006), located several arcseconds southwest of the kinematical center with an extent of order 10″ (Mauersberger et al. 1996; Peng et al. 1996; García-Burillo et al. 2000; Paglione et al. 2004; Güsten et al. 2006; Lebrón et al. 2011; Sakamoto et al. 2011; Bolatto et al. 2013). The similarly extended lower velocity component near 170 km s-1, mainly arising from several arcseconds northeast of the dynamical center, is too weak to be detected at significant levels (but see Sect. 3.8). For the dominant 00 → 1-1 E line of methanol (CH3OH), we obtain VLSR = (294 ± 4) km s-1. While this inhibits a comparison of the two major molecular lobes near the center of NGC 253, the dominance of the high velocity component in the spectra is nevertheless positive. It reduces the line widths considerably and hence the blending of nearby spectral features.
A search for vibrationally excited CN turned out to be unsuccessful. The higher frequency fine structure components of the v = 1N = 1 → 0 and 2 → 1 CN transitions are blended by 12C17O J = 1 → 0 and 2 → 1. For the lower frequency fine structure components, we obtain at λ ~ 3 and 1.3 mm 1σ noise levels of 3 and 4 mK (15 and 20 mJy) with a channel width of 8.5 km s-1.
3.3. Importance of CN
Toward NGC 253, the 12C/13C carbon isotope ratio has been previously estimated from CS (Henkel et al. 1993) and C2H (Martín et al. 2010). While the former authors propose 12C/13C ~ 40, the latter find 12C/13C > 81. In view of the scarcity of 12C/13C determinations from extragalactic sources, this discrepancy is important to resolve. This is one of the main goals of this paper.
As explained in Sect. 3.2, mm-wave CN spectra contain a multitude of individual features. Therefore, a comparison between the tracer species with highest intensities, CO, HCN, HCO+, HNC, and CN, clearly favors CN when attempting to determine optical depths from relative line intensities to derive carbon isotope ratios (Henkel et al. 1998). This also holds when including C2H (Martín et al. 2010), because CN shows the broadest frequency coverage of spectral fine structure within its mm-wave transitions, which is sufficient even in the case of rotationally broadened lines from an edge-on spiral galaxy (e.g., Fig. 1).
3.4. Problems related to previous 12C/13C determinations
The 12C/13C ~ 40 estimate from CS by Henkel et al. (1993) for NGC 253 was based on the assumption of a 32S/34S ratio of 23 as measured in the solar system and the local interstellar medium (Penzias 1980; Wannier 1980). More recent data, however, indicate a strong positive 32S/34S gradient in the Galactic disk (Chin et al. 1996) with 32S/34S of order 13.5 in the inner disk and a possibly similar ratio in the nuclear starburst environment of another active nearby spiral galaxy, NGC 4945 (Wang et al. 2004).
For a ratio of 32S/34S = 13.5, following the procedure outlined by Henkel et al. (1993), we would obtain 12C/13C ~ 23 for NGC 253. More recently, Martín et al. (2005, 2006) obtained I(12C32S 3–2)/I(12C34S 3–2) ~ 5.7 and I(12C32S 3–2)/I(13C32S 3–2) ~ 27. (The ratios were calculated from their Tables 1, giving integrated intensities, while Martín et al. 2005, discuss I(12C32S 3–2)/I(13C32S 3–2) = 21 ± 3 in their Sect. 3.1, derived from peak flux densities.) With the data from their Table 1 and 32S/34S = 13.5, we obtain, following the same procedure (Henkel et al. 1993), from CS a carbon isotope ratio of 12C/13C ~ 70 for NGC 253.
In this context it has to be mentioned that 32S/34S = 8 ± 2, as suggested by Martín et al. (2005), cannot be adopted because it has been derived from the 12C/13C ~ 40 ratio proposed by Henkel et al. (1993) under the assumption of 32S/34S = 23. However, the sulfur isotope ratio of >16, suggested more recently by Martín et al. (2010), is free of such a contradiction. To summarize, the poorly constrained sulfur isotope ratio in NGC 253 and the (initially unknown) strong Galactic 32S/34S gradient (Chin et al. 1996), allowing for a wide range of ratios at least in the Galaxy, inhibit any reliable determination of NGC 253’s carbon isotope ratio based on CS. In view of the qualitative nature of the above-mentioned ratios, a systematic analysis of error budgets is not feasible.
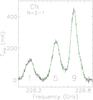 |
Fig. 2 CN N=2 → 1 spectrum (black) and Gaussian fits (green) of NGC 253 in units of main beam brightness temperature on a LSR VLSR = 0 km s-1 frequency scale. The profile has been smoothed to a channel spacing of ~2.1 km s-1 (1.5625 MHz). Numbers at the foot of each spectral feature provide expected relative intensities with respect to the weakest group of lines in case of optically thin emission under conditions of local thermodynamical equilibrium. |
3.5. Estimating 12CN/13CN, excitation temperature, and column density
With two detected groups of features in the CN and 13CN N = 1 → 0 lines (Fig. 1) and three in the CN N = 2 → 1 transition (Fig. 2), we are able to quantify opacity effects without having to rely on a second isotope ratio (like that of 32S/34S). Therefore, CN provides a good data base to directly estimate the 12C/13C ratio in NGC 253. If local thermodynamical equilibrium (LTE) holds and lines are optically thin, line intensity ratios should be 1:2 (CN N = 1 → 0), 1.225:1 (13CN N = 1 → 0), and 1:5:9 (CN N = 2 → 1), when moving from left to right with increasing frequency in Figs. 1 and 2.
Dividing the integrated intensities of the CN and 13CN N = 1 → 0 transitions, we obtain I(CN)/I(13CN) = 40. Also accounting for the F1, F2 = 0 → 113CN components near 108.4, which are not seen but contribute 7.6% to the total 13CN emission in the case of optically thin lines and prevailing LTE conditions (see Bogey et al. 1984), the ratio drops to I(CN)/I(13CN) = 37.5 for the N = 1 → 0 transition.
To estimate the CN excitation temperature, we note that the N = 2 → 1/1 →
0 line intensity ratio is 1.655 (Table 2) on a frequency scale and 0.83 on a velocity scale. The latter is relevant
here. Accounting for the fact that the CN N = 2 → 1 linear beam size θb is half that
of the N = 1 →
0 line and assuming that the source size is small with respect to
θb,CN2
−1, beam dilution is four times higher for the N = 1 → 0 than for the
2 → 1 transition. The
corrected line intensity ratio then becomes 0.21. Figure 2c of Mauersberger et al. (1996) suggests that the high velocity CO
J = 2 → 1
emission has an extent comparable to θb, CN2 − 1. Since CN
may arise from an even more compact region, this provides an upper limit to the possible
extent of the CN emission. Therefore the real CN N = 2 → 1/1 →
0 intensity ratio may be close to 0.25, but below we account for the
entire range of possible values. For optically thin emission, we use the N = 2 →/1 →
0 ratio to constrain the excitation temperature via
 (e.g.,
Wang et al. 2004), where x =
hν10/kTex,
ν10 =
113.386 GHz (an averaged CN N = 1 → 0 rest frequency), and y =
hν10/ 2.73
k = 1.99. In this way we derive an excitation
temperature of
(e.g.,
Wang et al. 2004), where x =
hν10/kTex,
ν10 =
113.386 GHz (an averaged CN N = 1 → 0 rest frequency), and y =
hν10/ 2.73
k = 1.99. In this way we derive an excitation
temperature of  K.
The error limits account for the entire range of possible line intensity ratios from 0.21
to 0.83. For an estimate also discussing effects of line saturation and non-LTE
excitation, see Sect. 3.7.
K.
The error limits account for the entire range of possible line intensity ratios from 0.21
to 0.83. For an estimate also discussing effects of line saturation and non-LTE
excitation, see Sect. 3.7.
3.6. Potential uncertainties in the derived carbon isotope ratio
Toward NGC 253, 12C/13C line intensity ratios from carbon-bearing species with well detected 13C-containing isotopologues are given by Henkel et al. (1993) for CO J = 1 → 0 and 2 → 1, HCN J = 1 → 0, HCO+J = 1 → 0, and CS J = 3 → 2. These ratios do not surpass 20 and can be taken as lower limits in view of the unknown but certainly substantial optical depths of the main isotopologues. Martín et al. (2005, 2006) find (as already mentioned) a ratio of 27 for CS J = 3 → 2. In view of all these data, our determination of the CN/13CN N = 1 → 0 line intensity ratio of order 40 is a major step ahead. However, questions related to fractionation, isotope selective photodissociation, calibration, and optical depths of the main CN species still remain to be discussed.
3.6.1. Chemical fractionation and isotope selective photodissociation
Langer et al. (1984) modeled the fractionation of oxygen and carbon in dense interstellar clouds with time-dependent chemistry, involving cloud lifetimes up to 108 yr, kinetic temperatures of 6–80 K, and densities of 5 × 10²–105 cm-3 for a wide range of metal abundances. While oxygen isotope fractionation is insignificant under all considered conditions, carbon fractionation occurs, resulting in CO providing too low 12C/13C ratios, HCO+ delivering quite accurate ones, and CN, CS, HCN, and H2CO yielding them too high.
Observations of H2CO, C18O, and CN, including the corresponding 13C-bearing species, across the Galactic plane (Henkel et al. 1982; Langer & Penzias 1990; Milam et al. 2005) demonstrate how large the numerically predicted discrepancies may become in the real world. Observationally, the carbon isotope ratios from H2CO turn out to be higher by ~30% than those from C18O and CN, which are quite similar. Finding a synthesis for all these data sets, Milam et al. (2005) conclude that there is good agreement between all measured 12C/13C values at a given galactocentric radius, independent of the kinetic temperature of the cloud observed. Thus chemical fractionation and isotope selective photodissociation do not play a dominant role.
In addition to the advantage of CN showing a peculiar spectral fine structure (see Sect. 3.3), we thus also find that there is an exemplary Galactic data set on CN/13CN (Milam et al. 2005). There is no such analog for C2H, encompassing the Galactic disk and center, which would be relevant for the analysis of NGC 253 by Martín et al. (2010). Since C2H is a molecule, which may also permit deriving line opacities of the main isotopologue in galaxies with moderate line widths, a systematic survey of C2H, 13CCH, and C13CH across the Galaxy would be highly desirable by providing interesting insights into astrochemistry, possibly delivering a benchmark for extragalactic data, and allowing us to critically compare carbon ratios derived from CN and C2H also in extragalactic sources. In view of similar results from H2CO, C18O, and CN in the Galaxy (Milam et al. 2005), we expect compatible results from C2H as well, but this has still to be demonstrated in a rigorous way. Although it would be unexpected (see, e.g., Wang et al. 2009, who find that the LMC is well mixed with respect to the carbon isotope ratio), we can also not yet firmly exclude that CN and C2H trace different regions with different 12C/13C values.
Deviations from relative LTE intensities of different features within the N = 1 → 0 or 2 → 1 transitions of C2H have been found to be small (e.g., Padovani et al. 2009), suggesting that C2H will be useful for studies of isotope ratios. Furthermore, CN and C2H appear to be chemically related. Both are common tracers of dark clouds (e.g., Padovani et al. 2009, and references therein) and are also probes of photon-dominated regions (PDRs; e.g., Simon et al. 1997; Rimmer et al. 2012). Because of high critical densities (for C2H, see Spielfiedel et al. 2012; for CN, see Sect. 3.7), their molecular line emission should be weak in clouds of low density. In view of all these common properties, significantly different 12C/13C ratios from CN and C2H would be a great surprise.
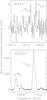 |
Fig. 3 C18O and 13CO J = 1 → 0 spectra from NGC 253 (lower panel) and Mrk 231 (upper panel) on a LSR VLSR = 0 km s-1 frequency scale. The spectra were smoothed to channel spacings of ~4.26 and ~60.0 km s-1 (1.53 and 21.0 MHz), respectively. In the lower panel, the features at 109.8 and 110.27 GHz belong to HNCO J = 5 → 4 and CH3CN J = 6 → 5. |
3.6.2. Calibration
Table 1 shows a drastic difference between the system temperatures of the two λ ~ 3 mm spectra centered at 109.635 and 113.365 GHz. This is mainly a consequence of the extinction caused by atmospheric O2 near 118 GHz. While previous studies were made with comparatively small bandwidths, here we face the problem that a single system temperature stands for a spectrum with supposedly quite different atmospheric extinctions at its low and high frequency edges. Because of this, we have to compare our measured main beam brightness temperatures with those of previous studies.
Only data from the 30-m IRAM telescope are considered here. With respect to 13C16O (hereafter 13CO) and 12C18O (hereafter C18O) J = 1 → 0 near 110 GHz (Fig. 3), agreement with the profiles of Harrison et al. (1999) is excellent. When compared with Fig. 1 of Henkel et al. (1993), this also holds for the two main groups of features of the CN N = 2 → 1 transition near 226 GHz. While our signal-to-noise ratios are much higher, there is also no notable discrepancy between Fig. 1 of Henkel et al. (1993) and our 13CN spectrum near 108.6 GHz (Fig. 1, upper panel). This mainly refers to the CH3OH 00 → 1-1 line, because the noise level in the previously published spectrum is too high to detect 13CN. Here we should note that all lines considered so far are displaced well away from the atmospheric 118 GHz O2 feature so that atmospheric extinction is not expected to vary strongly within the individually observed 4 GHz wide frequency bands.
Nevertheless, there are also inconsistencies. Henkel et al. (1988) measured only Tmb ~ 250 mK for CN N = 2 → 1, which is lower than what Henkel et al. (1993) reported five years later and what we have observed in this study (~450 mK; cf. Table 2). The IRAM 30-m telescope has been greatly improved during the years between 1988 and 1993, so the later observation should be preferred, providing support for our spectrum displayed in Fig. 2. More critical is CN N = 1 → 0, because it has been observed in the 4 GHz wide band also covering CO J = 1 → 0 at the edge of the atmospheric 118 GHz O2 feature. Henkel et al. (1988, 1993) find Tmb ~ 300 and 350 mK for CN N = 1 → 0, which is ~40% and 25% below our value (Table 2). With the CN N = 1 → 0 frequencies being located in between those of 13CO and C18O J = 1 → 0 and CO J = 1 → 0, our CO peak intensity is also relevant for an evaluation of calibration uncertainties. With Tmb ~ 5.7 (Fig. 4), we obtain a value well above the one shown in Fig. 5c of Mauersberger et al. (1996), reaching only ~4 K for the VLSR ~ + 290 km s-1 velocity component seen by us (Sect. 3.2). This difference of ~30% relative to our result is similar to the deviation obtained for CN N = 1 → 0 and will be implemented as the main uncertainty in our estimate of the carbon isotope ratio (see Sect. 3.7).
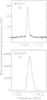 |
Fig. 4 CO J = 1 → 0 spectra from NGC 253 (lower panel) and Mrk 231 (upper panel) on a LSR VLSR = 0 km s-1 frequency scale. The spectra were smoothed to channel spacings of ~8.52 and 10.84 km s-1 (3.125 and 4.0 MHz), respectively. The frequency range of the upper panel is wider to show the molecular outflow at the foot of the main spectral component, seen in CO and other species (e.g., Feruglio et al. 2010; Aalto et al. 2012). |
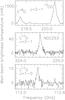 |
Fig. 5 13CO, C18O, and C17O spectra from NGC 253 (see also Figs. 3 and 4) on a LSR VLSR = 0 km s-1 frequency scale. The profiles were smoothed to channel spacings of ~8.5, 8.5, and 17 km s-1 from top to bottom, which corresponds to 6.25 MHz. |
3.6.3. Optical depths
CN has been observed in several clouds of the Galactic center region (Henkel et al. 1998), which is as close as we can get to the physical conditions prevailing in the nuclear region of NGC 253. Toward cloud cores, deviations of the individual spectral features from LTE were found to be moderate. Integrated intensity ratios are I(CN)/I(13CN) = 9–15 in the N = 1 → 0 line, which is below the canonical Galactic center ratio of 12C/13C ~ 25, indicating moderate CN saturation. In this context, we should also mention the interferometric CN observations of the innermost 4 pc of our Galaxy (Martín et al. 2012), which yield carbon isotope ratios of 15–45. We note, however, that this study addresses a very small region compared to those discussed here.
In NGC 253, the line intensity ratio of the two 13CN N = 1 → 0 features is
1.165 ± 0.215, which is
consistent with LTE and optically thin emission (Fig. 1, upper panel). We may, however, face some moderate saturation in the CN
N = 1 → 0
line. Instead of the 2-to-1 ratio expected under LTE conditions with optically thin
lines, the ratio of integrated intensities between the J = 3/2 →
1/2 and 1/2 →
1/2 groups of lines is 1.55 ± 0.01 (see Fig. 1 and Table 2). We note,
however, that the peak line intensity ratio between the two groups of line components is
almost exactly two. The stronger spectral component is narrower, a consequence of the
relative frequencies of its individual hyperfine components. To get twice the integrated
intensity, the stronger component would have to have a peak temperature of
Tmb =
606 mK, ~2.5 times the Tmb value of the weaker component.
With the observed 479 mK instead (Table 2) and
assuming equal excitation temperatures for all individual features, we can apply the
radiative transfer equation to determine the optical depth via
 This
gives a peak optical depth of τ ~ 0.5. For the other measured CN
1 → 0 feature, we then
obtain an optical depth of τ
~ 0.2, and effects due to saturation should amount to ~26.5% and 10%, respectively.
This
gives a peak optical depth of τ ~ 0.5. For the other measured CN
1 → 0 feature, we then
obtain an optical depth of τ
~ 0.2, and effects due to saturation should amount to ~26.5% and 10%, respectively.
3.7. Consequences
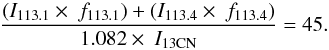
To determine the carbon isotope ratio, we thus multiply the integrated intensity
I113.1 of the weaker CN N = 1 → 0 feature by
f113.1 =
1.1 and that of the stronger one, I113.4, by
f113.4 =
1.265 to account for line saturation (here and below, the indices refer
to redshifted frequencies in units of GHz). With the values given in Table 2 and the correction to the measured I13CN intensity
mentioned in Sect. 3.5, we then obtain a 12CN/13CN N = 1 → 0 ratio of
 This
should be consistent with the carbon isotope ratio (e.g., Milam et al. 2005). The main error could be caused by an
overestimate of our CN 1 → 0
main beam brightness temperature scale by ~30%, as outlined in Sect. 3.6.2. This would reduce the isotope ratio
to a value of approximately 30. Since all other errors appear negligible relative to this
one, we conclude that the carbon isotope ratio is 30–50 in the southwestern
starburst core of NGC 253. This is well below the lower limit proposed by
Martín et al. (2010), while it is perfectly
consistent with the ratio derived by Henkel et al. (1993) from CS. Nevertheless, we consider this latter agreement as fortuitous. It
implies that the 32S/34S sulfur isotope ratio in the central part of NGC 253
is close to the local interstellar value, in agreement with >16, the value
suggested by Martín et al. (2010). While all this
is highly consistent and straightforward, we still have to emphasize that the derived
carbon isotope ratio is based on the assumption that the intrinsic CN N = 1 → 0 relative line
strengths are, like those of 13CN 1 →
0, close to their LTE values (for further support for this assumption,
see Sect. 4.1).
This
should be consistent with the carbon isotope ratio (e.g., Milam et al. 2005). The main error could be caused by an
overestimate of our CN 1 → 0
main beam brightness temperature scale by ~30%, as outlined in Sect. 3.6.2. This would reduce the isotope ratio
to a value of approximately 30. Since all other errors appear negligible relative to this
one, we conclude that the carbon isotope ratio is 30–50 in the southwestern
starburst core of NGC 253. This is well below the lower limit proposed by
Martín et al. (2010), while it is perfectly
consistent with the ratio derived by Henkel et al. (1993) from CS. Nevertheless, we consider this latter agreement as fortuitous. It
implies that the 32S/34S sulfur isotope ratio in the central part of NGC 253
is close to the local interstellar value, in agreement with >16, the value
suggested by Martín et al. (2010). While all this
is highly consistent and straightforward, we still have to emphasize that the derived
carbon isotope ratio is based on the assumption that the intrinsic CN N = 1 → 0 relative line
strengths are, like those of 13CN 1 →
0, close to their LTE values (for further support for this assumption,
see Sect. 4.1).
With f113.1 and f113.4,
accounting for saturation effects in the CN 1 →
0 transition, and neglecting those eventually existing in the
N = 2 → 1
line, we can now also re-evaluate the CN excitation temperature from a modified CN
N = 2 → 1 /
1 → 0 intensity ratio, which drops from 0.83 to 0.69 on a velocity
scale (see Sect. 3.5). This line ratio would be reduced to 0.172 in case of a point source
due to the different beam-filling factors of the two lines. Following the discussion in
Sect. 3.5 and adopting a ratio of 0.2, this results in
 K
with the given errors covering the entire range of allowed line ratios from 0.172 to 0.69.
K
with the given errors covering the entire range of allowed line ratios from 0.172 to 0.69.
CO line parameters for NGC 253 and CO and CN line parameters for Mrk 231, obtained from Gaussian fits.
The intensity ratio of the two main CN N = 2 → 1 spectral features (Fig. 2) is close to the LTE value of 1.8:1. Their ratio of peak intensities is 1.76 ± 0.02 and the ratio of integrated intensities is 1.61 ± 0.01, while line widths are similar. This suggests that saturation only plays a minor role, affecting line intensities by ≲10%, as is also suggested by the moderate opacities of the 1 → 0 lines and the low excitation temperature derived above. This effectively reduces populations in the higher N-levels. While all this is perfectly consistent, the intensity of the weakest 2 → 1 feature (Fig. 2) diverges significantly. This component appears to be far too strong relative to the others.
An alternative view of the N
= 2 → 1 line (see Fig. 2) would be
that the strongest and weakest N = 2 → 1 features are in LTE, while the central
feature is depleted by a non-LTE effect. Then saturation effects would reduce the main
beam brightness temperature of the strongest feature from 1274 mK (nine times the peak
intensity of the weakest feature multiplied by the ratio of the two line widths, 1.097;
see Fig. 2 and Table 2) to the observed 445 mK, implying a peak optical depth of τ ~ 3.7. Calculating the
excitation temperature in this way by adopting half this peak optical depth for the weaker
central feature, we obtain, with the values of Table 2, i.e. integrating over frequency, a N = 2 → 1/1 → 0 line intensity
ratio of 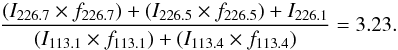 For
the quantities in the denominator, see the previous equation. For the numerator, we have
f226.7 =
2.86 and f226.5 = 2.20. Integrating not over
frequency but over velocity, which is the proper unit, yields half the CN line intensity
ratio, 1.614, or, for a point source (see Sect. 3.5), 0.403. The resulting excitation then
becomes 4.2 K
<Tex<
11.3 K. Because the CN emission is probably not extended with respect
to the beam (Sect. 3.5), the actual excitation temperature should be close to 4 K, still a
very low value in spite of all the corrections we have made. It is also small in view of
the excitation temperatures derived from other species in NGC 253 (Martín et al. 2006), strongly indicating subthermal excitation. The
critical density of CN N = 1 →
0, where collisional excitation rates match those for spontaneous
radiative decay, is high (ncrit ~ 106 cm-3) and almost as large as that
for HCN J = 1 →
0. Therefore, subthermal emission from a predominantly lower density
medium is no surprise. The corresponding CN column density is 1.7 × 1015 cm-2 but could be up to a factor of
20 higher and almost an order of magnitude lower for the limiting cases Tex = 11.3 and
3.0 K (the latter obtained prior to correct for CN N = 2 → 1 line saturation).
We further note that these column density estimates are speculative, because there may
exist a hot, dense component with Tex well above 10 K, which might only
become visible when observing higher N transitions (for CN chemistry, see, e.g., Simon
et al. 1997; Liszt & Lucas 2001). Adopting exclusively collisional excitation and
using RADEX (van der Tak et al. 2007),
Tex =
4.0 K corresponds to a density of n(H2) ~ 2.5 ×
104 cm-3 for kinetic temperatures of 50–100 K. This involves
Einstein coefficients from Klisch et al. (1995), a
dipole moment of 1.45 Debye (Thomson & Dalby 1968), and He-impact rates from Lique et al. (2010) scaled by 1.37 to simulate H2.
For
the quantities in the denominator, see the previous equation. For the numerator, we have
f226.7 =
2.86 and f226.5 = 2.20. Integrating not over
frequency but over velocity, which is the proper unit, yields half the CN line intensity
ratio, 1.614, or, for a point source (see Sect. 3.5), 0.403. The resulting excitation then
becomes 4.2 K
<Tex<
11.3 K. Because the CN emission is probably not extended with respect
to the beam (Sect. 3.5), the actual excitation temperature should be close to 4 K, still a
very low value in spite of all the corrections we have made. It is also small in view of
the excitation temperatures derived from other species in NGC 253 (Martín et al. 2006), strongly indicating subthermal excitation. The
critical density of CN N = 1 →
0, where collisional excitation rates match those for spontaneous
radiative decay, is high (ncrit ~ 106 cm-3) and almost as large as that
for HCN J = 1 →
0. Therefore, subthermal emission from a predominantly lower density
medium is no surprise. The corresponding CN column density is 1.7 × 1015 cm-2 but could be up to a factor of
20 higher and almost an order of magnitude lower for the limiting cases Tex = 11.3 and
3.0 K (the latter obtained prior to correct for CN N = 2 → 1 line saturation).
We further note that these column density estimates are speculative, because there may
exist a hot, dense component with Tex well above 10 K, which might only
become visible when observing higher N transitions (for CN chemistry, see, e.g., Simon
et al. 1997; Liszt & Lucas 2001). Adopting exclusively collisional excitation and
using RADEX (van der Tak et al. 2007),
Tex =
4.0 K corresponds to a density of n(H2) ~ 2.5 ×
104 cm-3 for kinetic temperatures of 50–100 K. This involves
Einstein coefficients from Klisch et al. (1995), a
dipole moment of 1.45 Debye (Thomson & Dalby 1968), and He-impact rates from Lique et al. (2010) scaled by 1.37 to simulate H2.
3.8. Beyond CN: Oxygen isotope ratios in NGC 253
Owing to bandwidths of 2 × 2 × 4 GHz (Sect. 2), our spectra not only contain CN but also include a number of CO lines (Figs. 3–5 and Sect. 3.6.2). Because of their strength and because line shapes are reflecting individual components and not groups of hyperfine components (the exception to this rule is 12C17O, hereafter C17O), not only is the VLSR ~ 290 km s-1 feature seen in the J = 1 → 0 lines (see Sect. 3.2), but also the lower velocity VLSR ~ 170 km s-1 component (e.g., Martín et al. 2006), which contributes 10% to 20% to the total line emission in our λ = 3 mm spectra. The J = 2 → 1 lines obtained with a smaller beam size (Table 1) are best fit by a single velocity component.
Table 3 summarizes the parameters of the Gaussian fits to the line profiles. Noteworthy are the extremely high I(C18O)/I(C17O) J = 1 → 0 and 2 → 1 ratios with respect to the Galactic interstellar medium (~3.5; Wouterloot et al. 2008), 12.7 ± 1.2 and 8.0 ± 0.3. These have already been noted before (e.g., Henkel & Mauersberger 1993), but the rotational lines of the different isotopologues could previously not be observed simultaneously. The high ratios of order 10 were interpreted in terms of vigorous massive star formation in a nuclear starburst, which contains a metal-rich gaseous composition.
Adopting 12C/13C = X = 40 ± 10 from CN (Sect. 3.7) and keeping in mind that at least in Galactic
star forming regions 12C/13C ratios from CN and C18O are similar (Milam et al.
2005), we can also estimate the optical depths of
the various CO isotopologues. When only accounting for the errors obtained from Gaussian
fits, the CO/13CO
J = 1 → 0
line intensity ratio becomes 13.98 ± 0.34 (Table 3). Since the intensity of the CO J = 1 → 0 line may be
overestimated by 30% (Sect. 3.6.2), we estimate a ratio of R = 10–14 and obtain with
 where
τ(CO
1 → 0) = Xτ = 1.8–5. This result
implies that 13CO
should be optically thin, not only in the J = 1 → 0 but also in the 2 → 1 transition. Testing this by comparing
the I(13CO)/I(C18O) line intensity ratios in the two ground rotational
transitions, we obtain 3.601 ± 0.046 and 3.628 ± 0.024. Within the limits of accuracy, the ratios agree with each
other, as expected in the case of optically thin emission. With the I(13CO)/I(C18O) value and with
8.9 ± 1.2 as the weighted
mean of the I(C18O)/I(C17O) ratio from the J = 1 → 0 and
2 → 1 transitions,
16O/18O = CO/13CO ×13CO/C18O = (40 ± 10) ×
(3.62 ± 0.05) =
145 ± 36 and 16O/17O = 16O/18O × C18O/C17O = (145 ± 36) × (8.9 ± 1.2) = 1290 ± 365 (see also Harrison et al. 1999).
where
τ(CO
1 → 0) = Xτ = 1.8–5. This result
implies that 13CO
should be optically thin, not only in the J = 1 → 0 but also in the 2 → 1 transition. Testing this by comparing
the I(13CO)/I(C18O) line intensity ratios in the two ground rotational
transitions, we obtain 3.601 ± 0.046 and 3.628 ± 0.024. Within the limits of accuracy, the ratios agree with each
other, as expected in the case of optically thin emission. With the I(13CO)/I(C18O) value and with
8.9 ± 1.2 as the weighted
mean of the I(C18O)/I(C17O) ratio from the J = 1 → 0 and
2 → 1 transitions,
16O/18O = CO/13CO ×13CO/C18O = (40 ± 10) ×
(3.62 ± 0.05) =
145 ± 36 and 16O/17O = 16O/18O × C18O/C17O = (145 ± 36) × (8.9 ± 1.2) = 1290 ± 365 (see also Harrison et al. 1999).
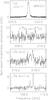 |
Fig. 6 CO J = 2 → 1 and CN spectra from Mrk 231 on a LSR VLSR = 0 km s-1 frequency scale. The spectra were smoothed to channel spacings of ~2.7, 22, 23, and 60 km s-1 (~2, 16, 16, and 21 MHz) from top to bottom. |
4. Other galaxies
4.1. CN in ULIRGs
In view of the extreme usefulness of CN as a tracer of the carbon isotope ratio (Sects. 3.3 and 3.6.1) and to complement our discussion of the relatively weak starburst in NGC 253, it is of interest to gain some idea of N = 1 → 0 and 2 → 1 CN emission from a truly luminous local ultraluminous infrared galaxy (ULIRG). With LIR~2.5 × 10¹² L⊙ at z = 0.0422 (e.g., Aalto et al. 2012), Mrk 231 is the target of choice. The two lower panels of Fig. 6 show the spectra, and Table 3 displays line parameters.
With the enormous infrared luminosity of Mrk 231, hinting at a high mass of dense star forming molecular gas, one might naively expect that the CN lines should be more saturated than in NGC 253. However, this is not entirely the case. The two components of the 1 → 0 transition have relative intensities exactly as expected for optically thin lines under LTE conditions. Excluding the unlikely case that this is an unfortunate combination of intrinsic non-LTE line strengths and high optical depth, this provides support for our assumption (Sect. 3.7) that “intrinsic intensities” (i.e., intensities after removing saturation effects) follow LTE conditions also in NGC 253.
Nevertheless, the CN spectra from Mrk 231 appear to originate in a different environment from those from NGC 253. While the peak line temperatures of the N = 1 → 0 and 2 → 1 lines are similar toward NGC 253, the 2 → 1 features are significantly stronger than the 1 → 0 lines in Mrk 231. Furthermore, the integrated line intensity ratios of the three 2 → 1 components in Mrk 231 unambiguously indicate saturation. Instead of ratios of 1:5:9, expected in the optically thin case (Fig. 2), the integrated intensity ratios are roughly 1:3:3.5 (Fig. 6 and Table 3). Therefore, it is clear that the CN excitation temperature must be higher in Mrk 231 than in NGC 253.
For a quantitative estimate, we assume again that the intrinsic intensities (i.e.,
intensities in the absence of line saturation) follow LTE conditions. (There is no
indication of non-LTE effects, because features expected to be stronger are stronger and
features expected to be weaker are indeed weaker; see Fig. 6.) Using the same approach as in Sect. 3.7, this yields opacities of
τ =
0.3 ± 0.2,
1.4 ,
and 2.9
,
and 2.9 for the three CN N = 2 →
1 components. To correct relative column densities for these optical
depths by τ/(1–e−τ), we obtain a factor of
2.3
for the three CN N = 2 →
1 components. To correct relative column densities for these optical
depths by τ/(1–e−τ), we obtain a factor of
2.3 ,
yielding a modified intensity ratio of I′(CN 2 → 1)/I(CN
,
yielding a modified intensity ratio of I′(CN 2 → 1)/I(CN
 .
Since we integrated over frequency and not yet over velocity, this value has to be reduced
by a factor of two. Accounting for the different beam sizes at λ = 3 and 1.3 mm and
realizing that Mrk 231 is spatially unresolved in all of the 30-m beams (e.g., Aalto et
al. 2012), the final ratio is I(CN 2 → 1)/I(CN
.
Since we integrated over frequency and not yet over velocity, this value has to be reduced
by a factor of two. Accounting for the different beam sizes at λ = 3 and 1.3 mm and
realizing that Mrk 231 is spatially unresolved in all of the 30-m beams (e.g., Aalto et
al. 2012), the final ratio is I(CN 2 → 1)/I(CN
 .
By adopting the procedure outlined in Sect. 3.5, this yields an excitation temperature of
.
By adopting the procedure outlined in Sect. 3.5, this yields an excitation temperature of
 K
and a tentative 22″
beam-averaged column density of N(CN
K
and a tentative 22″
beam-averaged column density of N(CN cm-2. Using RADEX (see Sect. 3.7),
the corresponding density becomes n(H2) ~ 8 × 104 cm-3. While uncertainties are
large, this hints at an excitation temperature that is about twice as large as in NGC 253
(Sect. 3.5) and NGC 4945 (Wang et al. 2004) and
indicates that CN transitions with quantum numbers N >
2 may be of interest, at least in ULIRGs.
cm-2. Using RADEX (see Sect. 3.7),
the corresponding density becomes n(H2) ~ 8 × 104 cm-3. While uncertainties are
large, this hints at an excitation temperature that is about twice as large as in NGC 253
(Sect. 3.5) and NGC 4945 (Wang et al. 2004) and
indicates that CN transitions with quantum numbers N >
2 may be of interest, at least in ULIRGs.
4.2. The carbon isotope ratio in starbursts across the universe
As we have seen (Sect. 3.7), the 12C/13C ratio of the nuclear starburst in NGC 253 is, at least for the high velocity (VLSR ~ 290 km s-1; Sect. 3.2) component, higher than in our Galactic center region. The presence of a bar (e.g., Engelbracht et al. 1998), likely providing significant inflow, may be a crucial factor that directs large quantities of fresh and poorly proccessed gas toward the nuclear region of NGC 253. While this gas also reaches the central part of our Galaxy (Riquelme et al. 2010), this process may occur on a much larger scale in NGC 253, where even indications of massive molecular feed back have already been detected (Turner 1985; Bolatto et al. 2013). For ongoing star formation, inflowing gas with high 12C/13C ratios may then become even more enriched in 12C by the material ejected from young massive stars.
Are all starburst galaxies alike with respect to their carbon isotope ratio? Here we may differentiate between starbursts in their early and late stages of evolution, as well as between weak and strong starbursts (see, e.g., Fig. 1 in Mao et al. 2010), the latter leading to the presence of (ultra)luminous infrared galaxies ((U)LIRGs). Finally, we may also distinguish between galaxies in the local and in the early universe.
NGC 253 has been believed to host a young starburst (e.g., García-Burillo et al. 2000; Wang et al. 2004), but in view of detected large scale outflows (Turner 1985; Bolatto et al. 2013), an intermediate stage of evolution appears to be more likely. With a total infrared luminosity of LIR ~ 3 × 10¹⁰ L⊙ (e.g., Henkel et al. 1986), its level of activity is at the low end of the range observed in the starbursts of spiral galaxies. A comparison of the carbon isotope ratio in NGC 253 with a starburst in a late stage of evolution of similar infrared luminosity, M 82, is not yet possible. Henkel et al. (1998) studied M 82 and proposed an isotope ratio of 12C/13C > 40 based on CN, and Martín et al. (2010) report a value >138 from C2H, but both results should be taken with some degree of scepticism, because 13CN and 13CCH or C13CH were not detected.
Mrk 231, one of the most luminous galaxies within a billion lightyears from Earth, contains an active galactic nucleus (AGN) and may host a starburst in a late stage of evolution. This can be deduced from the presence of only one nucleus in this galaxy merger and intense outflows of ionized and molecular gas (e.g., Feruglio et al. 2010; Aalto et al. 2012), rapidly exhausting the molecular star forming fuel in the central region. Figures 3, 4, and 6 show CO, 13CO, and C18O profiles. Comparing NGC 253 with Mrk 231, we note that the CO and C18O J = 1 → 0 peak temperatures are ~100 times higher in NGC 253, while for 13CO J = 1 → 0, the ratio exceeds 200. The I(12CO)/I(C18O) values are 30–40 in both sources. However, the 12CO/13CO line ratios are quite different, with I(12CO)/I(13CO)) = 10–14 in NGC 253 (Sect. 3.8) and 25–50 in Mrk 231 (Table 3). While the 12C/13C ratio in the nuclear region of NGC 253 is already higher than in our Galactic center region, it appears to be even higher in Mrk 231. In NGC 253, 13CO is much stronger than C18O in both ground rotational lines. In Mrk 231 both lines show similar intensities (Figs. 3 and 6) and should be optically thin in view of their weakness relative to CO.
Overall, assuming that the CO/C18O abundance ratios are the same, Mrk 231 should have a deficit in 13C by a factor of almost three relative to NGC 253 (for a statistical evaluation comprising many galaxies, see Taniguchi & Ohyama 1998; Taniguchi et al. 1999), possibly yielding 12C/13C ~ 100 and thus also 16O/18O ~ 100. Interestingly, Greve et al. (2009) and Martín et al. (2011) also find I(13CO) ~I(C18O) for the less evolved merger Arp 220. Furthermore, González-Alfonso et al. (2012) derive 16O/18O ~ 100 from OH Herschel data for the same source. Arp 220 still possesses two well separated nuclei and does not yet show any outflow that could match what is seen in Mrk 231. In view of their different stages of evolution, it is therefore surprising that Arp 220 and Mrk 231 can be characterized by quite similar carbon and 16O/18O ratios. Even the utraluminous eyelash galaxy at redshift 2.3, the first high-z galaxy with detected C18O emission, shows similar 13CO and C18O intensities (Danielson et al. 2013), indicating a 13C depletion with respect to local more quiescent galaxies. The LIRG NGC 1068 with an uncorrected I(12CN)/I(13CN) ratio of ~50 (Aladro et al. 2013) might be an intermediate case (however, its 13CN features are weaker and therefore show lower signal-to-noise ratios than those displayed in our Fig. 1). The Cloverleaf quasar at redshift z ~ 2.5 appears to be even more extreme. Based on a large number of CO data and the first detection of 13CO at high redshift, the 12C/13C ratio should be well above 100 (Henkel et al. 2010).
A summary of these results is given in Table 4, where sources with different properties are listed with their carbon isotope ratio. This is a first attempt to set up such a table. In the Galaxy, there is not only a carbon isotope ratio gradient, but also indications of dispersion at a given galactocentric radius (e.g., Milam et al. 2005), which is expected in view of radial gas streaming and potential cloud-to-cloud variations due to local supernovae or ejecta by late-type stars. With respect to external galaxies, we are still far away from such a level of precision. More accurate determinations of the carbon isotope ratio in the galaxies listed in Table 4, as well as in other extragalactic targets, including other classes of objects, are urgently needed. An obvious example would be M 82 as the prototype for a weak starburst at a late stage of evolution. Submillimeter galaxies (SMGs) would also be attractive.
Extragalactic carbon isotope ratios.
The few determined values (Table 4) indicate a trend with high-z ULIRGs showing the highest carbon isotope ratios. Low-z ULIRGs appear to contain more processed material but still show values near 12C/13C ~ 100. The high values compared to those found in most parts of the Milky Way indicate that (1) the bulk of the material originates in a massive inflow of poorly processed 13C deficient gas and/or that (2) there is a large input of 12C-rich gas from ejecta of massive stars. The latter might become more dominant, if the number of such stars were enhanced by a top-heavy stellar initial mass function, a result of the high kinetic temperatures expected in extreme cosmic-ray-dominated environments (Papadopoulos et al. 2011). Weaker starbursts may show a moderate enhancement over the classical value for the Galactic center region, but all these statements are still based on a rather small number of sources. Right now, we are only beginning to collect the required data for a comprehensive understanding of CNO and S/Si nucleosynthesis based on extragalactic molecular spectra.
5. Conclusions
Using the IRAM 30-m telescope at Pico Veleta, we have detected two CN isotopologues toward the nearby starburst galaxy NGC 253, four CO isotopologues toward NGC 253, and three CO isotopologues toward the ultraluminous merger galaxy Mrk 231. We also presented CN N = 1 → 0 and 2 → 1 spectra from Mrk 231. The main results of this study are:
-
CN appears to be the best tracer to determine carbon isotope ratios in nearby external galaxies.
-
Toward NGC 253, the measured 13CN N = 1 → 0 line intensities are compatible with local thermodynamical equilbrium (LTE) under optically thin conditions. The relative line intensities of the 12CN N = 1 → 0 features are best explained by LTE conditions modified by moderate saturation, affecting the peak intensity of the weaker component by ~10% and the stronger component by ~25%. For 12CN 2 → 1, either the weakest of the three observed line components is enhanced or the feature of intermediate intensity is depleted relative to the expected LTE intensity under optically thin conditions.
-
Accounting for calibration uncertainties and moderate saturation in the 12CN 1 → 0 line, the 12C/13C isotope ratio becomes 40 ± 10 for the molecular core peaking some arcseconds southwest of the dynamical center of NGC 253. Combined with data from several CO isotopologues and adopting this 12C/13C ratio also for the CO emitting gas (which is supported by results from Galactic CN and C18O data), this yields 16O/18O = 145 ± 36 and 16O/17O = 1290 ± 365.
-
Both CN and C2H show a number of hyperfine components, which allows us to determine optical depths even in extragalactic spectra covering a broad velocity range. A systematic survey of C2H and its 13C-bearing isotopologues in star forming clouds of the Galaxy would thus be essential to check whether resulting carbon isotope ratios are consistent with those already derived from H2CO, C18O, and CN.
-
Toward NGC 253, there is no indication of vibrationally excited CN. The lower frequency fine structure components in the v = 1, N = 1 → 0, and 2 → 1 transitions are not seen down to rms levels of 3 and 4 mK (15 and 20 mJy) in 8.5 km s-1 wide channels. Those at higher frequency are blended by C17O.
-
The CN excitation temperature in NGC 253, derived from the N = 1 → 0 and 2 → 1 lines, is 3–11 K, with a most likely value of Tex ~ 4 K. With this value, the column density becomes N(CN)= 2 × 1015 cm-2 and the density, assuming purely collisional excitation, becomes n(H2) ~ 2.5 × 104 cm-3.
-
CN data from the ultraluminous merger Mrk 231 indicate that the excitation temperature is enhanced by a factor of two with respect to NGC 253 and NGC 4945. In Mrk 231, relative CN line intensities within the N = 1 → 0 and 2 → 1 transitions are compatible with local thermodynamical equilibrium. While the 1 → 0 transitions appear to be optically thin, the 2 → 1 lines show significant saturation effects. In view of the excitation temperature, which indicates a density of almost 105 cm-3 assuming exclusively collisional excitation, it would make sense to observe CN transitions with higher quantum numbers N in Mrk 231 and other ultraluminous infrared galaxies (ULIRGs).
-
A comparison between NGC 253 and Mrk 231 shows that 13C16O is underabundant in Mrk 231 relative to 12C16O and 12C18O by almost a factor of three. This would yield 12C/13C ~ 100 and, because 13CO and C18O show similar intensities in both the J = 1 → 0 and 2 → 1 lines, also 16O/18O ~ 100. This is similar to the values determined for Arp 220, even though Arp 220 is a much less evolved ultraluminous merger.
-
Obtaining a synthesis of the carbon isotope ratios obtained so far from the central regions of actively star forming galaxies, the observed range of values appears to encompass a full order of magnitude. From ultraluminous galaxies at high redshift to local ULIRGs, to weaker local starbursting galaxies, and to the central molecular zone of the Milky Way, ratios are >100, ~100, ~40, and 25, respectively. While this matches qualitative expectations of decreasing 12C/13C values with time and metallicity, we note that (1) the extragalactic values are based on an extremely small data base and that (2) the ratios for the ULIRGs at high and low z are still rather uncertain. Furthermore, it still has to be evaluated how much 13C-deficient gas from the outer galactic regions and 12C-rich ejecta from massive stars in a nuclear starburst (the latter possibly enhanced by a top-heavy initial mass function) are contributing to raise the carbon isotope ratios during the lifetime of a starburst.
Based on observations carried out with the IRAM 30-m telescope. IRAM is supported by INSU/CNRS (France), the MPG (Germany), and IGN (Spain).
Grenoble Image and Line Data Analysis Software: http://www.ira.inaf.it/~brand/gag.html
Acknowledgments
We wish to thank the IRAM staff at the 30-m for their help with the observations and C. M. Walmsley and an anonymous referee for carefully reading the manuscript. Some of the work by C.H. has been carried out while visiting the ESO-ALMA group in Santiago de Chile. A.L.R.D. acknowledges an STFC studentship (ST/F007299/1).
References
- Aalto, S., Black, J. H., Johansson, L. E. B., & Booth, R. S. 1991, A&A, 249, 323 [Google Scholar]
- Aalto, S., García-Burillo, S., Muller, S., et al. 2012, A&A, 537, A44 [NASA ADS] [CrossRef] [EDP Sciences] [Google Scholar]
- Abia, C., Palmerini, S., Busso, M., & Cristallo, S. 2012, A&A, 548, A55 [NASA ADS] [CrossRef] [EDP Sciences] [Google Scholar]
- Aladro, R., Viti, S., Bayet, E., et al. 2013, A&A, 549, A39 [NASA ADS] [CrossRef] [EDP Sciences] [Google Scholar]
- Bogey, M., Demuynck, C., & Destombes, J. L. 1984, Can. J. Phys., 62, 1248 [NASA ADS] [CrossRef] [Google Scholar]
- Bolatto, A. D., Warren, S. R., Leroy, A. K., et al. 2013, Nature, 499, 450 [NASA ADS] [CrossRef] [PubMed] [Google Scholar]
- Casoli, F., Dupraz, C., & Combes, F. 1992, A&A, 264, 55 [NASA ADS] [Google Scholar]
- Chiappini, C., Matteucci, F., & Romano, D. 2001, ApJ, 554, 1044 [NASA ADS] [CrossRef] [Google Scholar]
- Chin, Y.-N., Henkel, C., Whiteoak, J. B., Langer, N., & Churchwell, E. B. 1996, A&A, 305, 960 [NASA ADS] [Google Scholar]
- Danielson, A. L. R., Swinbank, A. M., Smail, I., et al. 2013, MNRAS, 436, 2793 [NASA ADS] [CrossRef] [Google Scholar]
- Engelbracht, C. W., Rieke, M. J., Rieke, G. H., Kelly, D. M., & Achtermann, J. M. 1998, ApJ, 505, 639 [NASA ADS] [CrossRef] [Google Scholar]
- Feruglio, C., Maiolino, R., Piconcelli, E., et al. 2010, A&A, 518, L155 [NASA ADS] [CrossRef] [EDP Sciences] [Google Scholar]
- García-Burillo, S., Martín-Pintado, J., Fuente, A., & Neri, R. 2000, A&A, 355, 499 [NASA ADS] [Google Scholar]
- Gerin, M., Combes, F., Encrenaz, P., et al. 1984, A&A, 136, L17 [NASA ADS] [Google Scholar]
- González-Alfonso, E., Fischer, J., Graciá-Carpio, et al. 2012, A&A, 541, A4 [NASA ADS] [CrossRef] [EDP Sciences] [Google Scholar]
- Greve, T. R., Papadopoulos, P. P., Gao, Y., & Radford, S. J. E. 2009, ApJ, 692, 1432 [NASA ADS] [CrossRef] [Google Scholar]
- Güsten, R., Henkel, C., & Batrla, W. 1985, A&A, 149, 195 [NASA ADS] [Google Scholar]
- Güsten, R., Philipp, S. D., Weiß, A., & Klein, B. 2006, A&A, 454, L115 [NASA ADS] [CrossRef] [EDP Sciences] [Google Scholar]
- Harrison, A., Henkel, C., & Russel, A. 1999, MNRAS, 303, 157 [NASA ADS] [CrossRef] [Google Scholar]
- Henkel, C., & Mauersberger, R. 1993, A&A, 274, 730 [NASA ADS] [Google Scholar]
- Henkel, C., Wilson, T. L., & Bieging, J. 1982, A&A, 109, 344 [NASA ADS] [Google Scholar]
- Henkel, C., Güsten, R., & Gardner, F. F. 1985, A&A, 143, 148 [NASA ADS] [Google Scholar]
- Henkel, C., Wouterloot, J. G. A., & Bally, J. 1986, A&A, 155, 193 [NASA ADS] [Google Scholar]
- Henkel, C., Mauersberger, R., & Schilke, P. 1988, A&A, 201, L23 [NASA ADS] [Google Scholar]
- Henkel, C., Mauersberger, R., Wiklind, T., et al. 1993, A&A, 268, L17 [NASA ADS] [Google Scholar]
- Henkel, C., Wilson, T. L., Langer, N., Chin, Y.-N., & Mauersberger, R. 1994, in The Stucture and Content of Molecular Clouds, Lect. Notes Phys., 439, 72 [Google Scholar]
- Henkel, C., Chin, Y.-N., Mauersberger, R., & Whiteoak, J. B. 1998, A&A, 329, 443 [NASA ADS] [Google Scholar]
- Henkel, C., Tarchi, A., Menten, K. M., & Peck, A. B. 2004, A&A, 414, 117 [NASA ADS] [CrossRef] [EDP Sciences] [Google Scholar]
- Henkel, C., Downes, D., Weiß, A., Riechers, D., & Walter, F. 2010, A&A, 516, A111 [NASA ADS] [CrossRef] [EDP Sciences] [Google Scholar]
- Hodge, P. 1989, ARA&A, 27, 139 [NASA ADS] [CrossRef] [Google Scholar]
- Klisch, E., Klaus, T., Belev, S. P., Winnewisser, G., & Herbst, E. 1995, A&A, 304, L5 [NASA ADS] [Google Scholar]
- Langer, W. D., & Penzias, A. A. 1990, ApJ, 357, 477 [NASA ADS] [CrossRef] [Google Scholar]
- Langer, W. D., Graedel, T. E., Frerking, M. A., & Armentrout, P. B. 1984, ApJ, 277, 581 [NASA ADS] [CrossRef] [Google Scholar]
- Lebrón, M., Mangum, J. G., Mauersberger, R., et al. 2011, A&A, 534, A56 [NASA ADS] [CrossRef] [EDP Sciences] [Google Scholar]
- Levshakov, S. A., Centurión, M., Molaro, P., & Kostina, M. V. 2006, A&A, 447, L21 [NASA ADS] [CrossRef] [EDP Sciences] [Google Scholar]
- Lique, F., Spielfiedel, A., Feautrier, N., et al. 2010, J. Chem. Phys., 132, 024303 [NASA ADS] [CrossRef] [PubMed] [Google Scholar]
- Liszt, H., & Lucas, R. 2001, A&A, 370, 576 [NASA ADS] [CrossRef] [EDP Sciences] [Google Scholar]
- Mao, R.-Q., Schulz, A., Henkel, C., et al. 2010, ApJ, 724, 1336 [NASA ADS] [CrossRef] [Google Scholar]
- Martín, S., Martín-Pintado, J., Mauersberger, T., Henkel, C., & García-Burillo, S. 2005, ApJ, 620, 210 [NASA ADS] [CrossRef] [Google Scholar]
- Martín, S., Mauersberger, R., Martín-Pintado, J., Henkel, C., & García-Burillo, S. 2006, ApJS, 164, 450 [NASA ADS] [CrossRef] [Google Scholar]
- Martín, S., Aladro, R., Martín-Pintado, & Mauersberger, R. 2010, A&A, 522, A62 [NASA ADS] [CrossRef] [EDP Sciences] [Google Scholar]
- Martín, S., Krips, M., Martín-Pintado, J., et al. 2011, A&A, 527, A36 [NASA ADS] [CrossRef] [EDP Sciences] [Google Scholar]
- Martín, S., Martín-Pintado, J., Montero-Castaño, Ho, P. T. P., & Blundell, R. 2012, A&A, 539, A29 [NASA ADS] [CrossRef] [EDP Sciences] [Google Scholar]
- Mauersberger, R., Henkel, C., Wielebinski, R., Wiklind, T., & Reuter, H.-P. 1996, A&A, 305, 421 [NASA ADS] [Google Scholar]
- Mikolaitis, Ŝ, Tautvaiŝiené, G., Gratton, R., Bragaglia, A., & Carretta, E. 2012, A&A, 541, A137 [NASA ADS] [CrossRef] [EDP Sciences] [Google Scholar]
- Milam, S. N., Savage, C., Brewster, M. A., Ziurys, L. M., & Wyckoff, S. 2005, ApJ, 634, 1126 [NASA ADS] [CrossRef] [Google Scholar]
- Mouhcine, M., Ferguson, H. C., Rich, R. M., Brown, T. M., & Smith, T. E. 2005, ApJ, 633, 810 [NASA ADS] [CrossRef] [Google Scholar]
- Muller, S., Guélin, M., Dumke, M., Lucas, R., & Combes, F. 2006, A&A, 458, 417 [NASA ADS] [CrossRef] [EDP Sciences] [Google Scholar]
- Padovani, M., Walmsley, C. M., Tafalla, M., Galli, D., & Müller, H. S. P. 2009, A&A, 505, 1199 [NASA ADS] [CrossRef] [EDP Sciences] [Google Scholar]
- Paglione, T. A. D., Yam, O., Tosaki, T., & Jackson, J. M. 2004, ApJ, 611, 835 [NASA ADS] [CrossRef] [Google Scholar]
- Papadopoulos, P. P., Thi, W.-F., Miniati, F., & Viti, S. 2011, MNRAS, 414, 1705 [NASA ADS] [CrossRef] [Google Scholar]
- Pence, W. D. 1981, ApJ, 247, 473 [NASA ADS] [CrossRef] [Google Scholar]
- Peng, R., Zhou, S., Whiteoak, J. B., Lo, K. Y., & Sutton, E. C. 1996, ApJ, 470, 821 [NASA ADS] [CrossRef] [Google Scholar]
- Penzias, A. A. 1980, Science, 208, 663 [NASA ADS] [CrossRef] [Google Scholar]
- Puche, D., Carignan, C., & van Gorkom, J. H., 1991, AJ, 101, 456 [NASA ADS] [CrossRef] [Google Scholar]
- Rekola, R., Richer, M. G., McCall, M. L., et al. 2005, MNRAS, 361, 330 [NASA ADS] [CrossRef] [Google Scholar]
- Rimmer, P. B., Herbst, E., Morata, O., & Roueff, E. 2012, A&A, 537, A7 [NASA ADS] [CrossRef] [EDP Sciences] [Google Scholar]
- Riquelme, D., Amo-Baladrón, M. A., Martín-Pintado, J., et al. 2010, A&A, 523, A51 [NASA ADS] [CrossRef] [EDP Sciences] [Google Scholar]
- Sakamoto, K., Mao, R.-Q., Matsushita, S., et al. 2011, ApJ, 735, 19 [NASA ADS] [CrossRef] [Google Scholar]
- Sheffer, Y., Rogers, M., Federman, S. R., Lambert, D. L., & Gredel, R. 2007, ApJ, 667, 1002 [NASA ADS] [CrossRef] [Google Scholar]
- Simon, R., Stutzki, J., Sternberg, A., & Winnewisser, G. 1997, A&A, 327, L9 [NASA ADS] [Google Scholar]
- Skatrud, D. D., De Lucia, F. C., Blake, G. A., & Sastry, K. V. L. N. 1983, J. Mol. Spectr., 99, 35 [Google Scholar]
- Spielfiedel, A., Feautrier, N., Najar, F., et al. 2012, MNRAS, 421, 1891 [NASA ADS] [CrossRef] [Google Scholar]
- Stahl, O., Wilson, T. L., Henkel, C., & Appenzeller, I. 1989, A&A, 221, 321 [NASA ADS] [Google Scholar]
- Taniguchi, Y., & Ohyama, Y. 1998, ApJ, 507, L121 [NASA ADS] [CrossRef] [Google Scholar]
- Taniguchi, Y., Ohyama, Y., & Sanders, D. B. 1999, ApJ, 522, 214 [NASA ADS] [CrossRef] [Google Scholar]
- Thomson, R., & Dalby, F. W. 1968, Can. J. Phys., 46, 2815 [NASA ADS] [CrossRef] [Google Scholar]
- Turner, B. E. 1985, ApJ, 299, 312 [NASA ADS] [CrossRef] [Google Scholar]
- Ulvestad, J. S., & Antonucci, R. R. J. 1997, ApJ, 488, 621 [NASA ADS] [CrossRef] [Google Scholar]
- van der Tak, F. F. S., Black, J. H., Schöier, F. L., Jansen, D. J., & van Dishoeck, E. F. 2007, A&A, 468, 627 [NASA ADS] [CrossRef] [EDP Sciences] [Google Scholar]
- Wang, M., Henkel, C., Chin, Y.-N., et al. 2004, A&A, 422, 883 [NASA ADS] [CrossRef] [EDP Sciences] [Google Scholar]
- Wang, M., Chin, Y.-N., Henkel, C., Whiteoak, J. B., & Cunnningham, M. 2009, ApJ, 690, 580 [NASA ADS] [CrossRef] [Google Scholar]
- Wannier, P. G. 1980, ARA&A, 18, 399 [NASA ADS] [CrossRef] [Google Scholar]
- Wilson, T. L., & Rood, R. 1994, ARA&A, 32, 191 [NASA ADS] [CrossRef] [Google Scholar]
- Wouterloot, J. G. A., & Brand, J. 1996, A&AS, 119, 439 [NASA ADS] [CrossRef] [EDP Sciences] [Google Scholar]
- Wouterloot, J. G. A., Henkel, C., Brand, J., & Davis, G. R. 2008, A&A, 487, 237 [NASA ADS] [CrossRef] [EDP Sciences] [Google Scholar]
All Tables
CO line parameters for NGC 253 and CO and CN line parameters for Mrk 231, obtained from Gaussian fits.
All Figures
|
Fig. 1 CN N = 1 → 0 spectra (black) and Gaussian fits (green) from NGC 253 on a local standard of rest (LSR) VLSR = 0 km s-1 frequency scale. Both spectra are smoothed to a channel spacing of ~8.5 km s-1 (3.125 MHz). Lower panel: the J = 1/2 → 1 / 2 (left) and J = 3/2 → 1 /2 (right) groups of CN lines. Upper panel: the strongest feature is the 00 → 1-1 E line of CH3OH (methanol). Far left: the F1 = 0, F2 = 1 → 0 and F1 = 1, F2 = 1 → 1 groups of 13CN N = 1 → 0 lines. In between this spectral feature and the methanol line: the F1 = 1, F2 = 2 → 1 group of 13CN transitions (for CN and 13CN rest frequencies, see Skatrud et al. 1983; and Bogey et al. 1984). The emission on the righthand side of the methanol line near 108.9 GHz might be caused by SiS 6 → 5. Numbers at the foot of each spectral CN or 13CN feature provide expected relative intensities with respect to the weaker group of lines in case of optically thin emission under conditions of local thermodynamical equilibrium. For less sensitive CN spectra obtained with smaller bandwidths, see Fig. 1 of Henkel et al. (1993). |
| In the text | |
|
Fig. 2 CN N=2 → 1 spectrum (black) and Gaussian fits (green) of NGC 253 in units of main beam brightness temperature on a LSR VLSR = 0 km s-1 frequency scale. The profile has been smoothed to a channel spacing of ~2.1 km s-1 (1.5625 MHz). Numbers at the foot of each spectral feature provide expected relative intensities with respect to the weakest group of lines in case of optically thin emission under conditions of local thermodynamical equilibrium. |
| In the text | |
|
Fig. 3 C18O and 13CO J = 1 → 0 spectra from NGC 253 (lower panel) and Mrk 231 (upper panel) on a LSR VLSR = 0 km s-1 frequency scale. The spectra were smoothed to channel spacings of ~4.26 and ~60.0 km s-1 (1.53 and 21.0 MHz), respectively. In the lower panel, the features at 109.8 and 110.27 GHz belong to HNCO J = 5 → 4 and CH3CN J = 6 → 5. |
| In the text | |
|
Fig. 4 CO J = 1 → 0 spectra from NGC 253 (lower panel) and Mrk 231 (upper panel) on a LSR VLSR = 0 km s-1 frequency scale. The spectra were smoothed to channel spacings of ~8.52 and 10.84 km s-1 (3.125 and 4.0 MHz), respectively. The frequency range of the upper panel is wider to show the molecular outflow at the foot of the main spectral component, seen in CO and other species (e.g., Feruglio et al. 2010; Aalto et al. 2012). |
| In the text | |
|
Fig. 5 13CO, C18O, and C17O spectra from NGC 253 (see also Figs. 3 and 4) on a LSR VLSR = 0 km s-1 frequency scale. The profiles were smoothed to channel spacings of ~8.5, 8.5, and 17 km s-1 from top to bottom, which corresponds to 6.25 MHz. |
| In the text | |
|
Fig. 6 CO J = 2 → 1 and CN spectra from Mrk 231 on a LSR VLSR = 0 km s-1 frequency scale. The spectra were smoothed to channel spacings of ~2.7, 22, 23, and 60 km s-1 (~2, 16, 16, and 21 MHz) from top to bottom. |
| In the text | |
Current usage metrics show cumulative count of Article Views (full-text article views including HTML views, PDF and ePub downloads, according to the available data) and Abstracts Views on Vision4Press platform.
Data correspond to usage on the plateform after 2015. The current usage metrics is available 48-96 hours after online publication and is updated daily on week days.
Initial download of the metrics may take a while.