Fig. 1
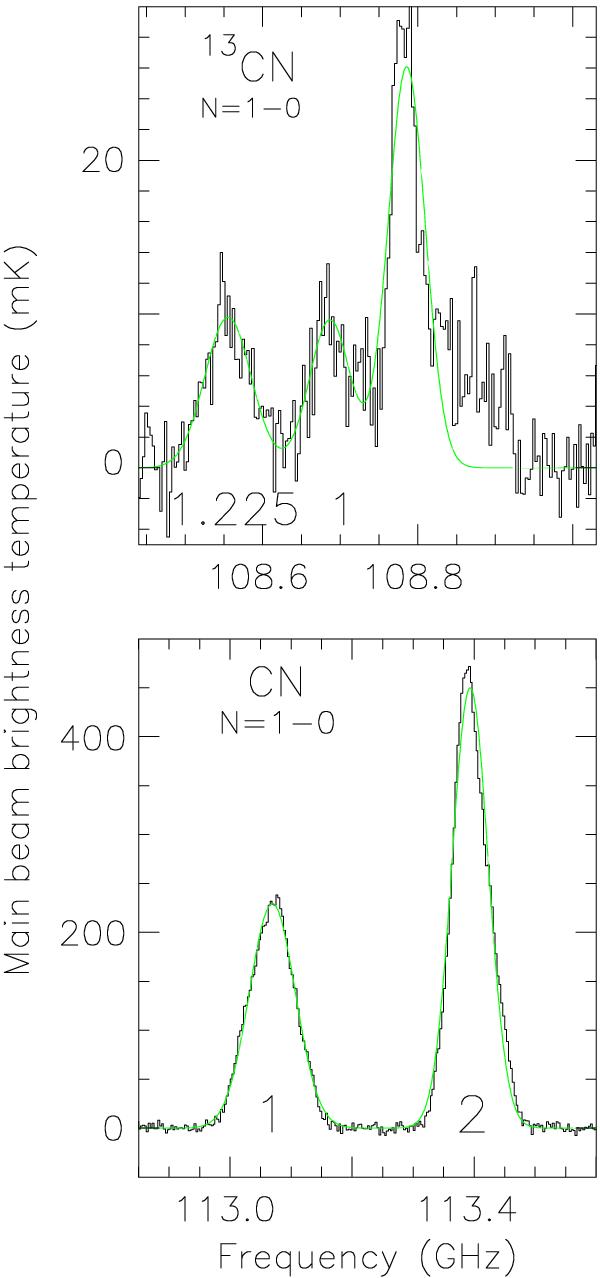
CN N = 1 → 0 spectra (black) and Gaussian fits (green) from NGC 253 on a local standard of rest (LSR) VLSR = 0 km s-1 frequency scale. Both spectra are smoothed to a channel spacing of ~8.5 km s-1 (3.125 MHz). Lower panel: the J = 1/2 → 1 / 2 (left) and J = 3/2 → 1 /2 (right) groups of CN lines. Upper panel: the strongest feature is the 00 → 1-1 E line of CH3OH (methanol). Far left: the F1 = 0, F2 = 1 → 0 and F1 = 1, F2 = 1 → 1 groups of 13CN N = 1 → 0 lines. In between this spectral feature and the methanol line: the F1 = 1, F2 = 2 → 1 group of 13CN transitions (for CN and 13CN rest frequencies, see Skatrud et al. 1983; and Bogey et al. 1984). The emission on the righthand side of the methanol line near 108.9 GHz might be caused by SiS 6 → 5. Numbers at the foot of each spectral CN or 13CN feature provide expected relative intensities with respect to the weaker group of lines in case of optically thin emission under conditions of local thermodynamical equilibrium. For less sensitive CN spectra obtained with smaller bandwidths, see Fig. 1 of Henkel et al. (1993).
Current usage metrics show cumulative count of Article Views (full-text article views including HTML views, PDF and ePub downloads, according to the available data) and Abstracts Views on Vision4Press platform.
Data correspond to usage on the plateform after 2015. The current usage metrics is available 48-96 hours after online publication and is updated daily on week days.
Initial download of the metrics may take a while.